Solana Price Prediction As Selling Pressure Signals A Pullback


Solana Price Prediction: The Solana coin has seen significant growth since mid-September, surging from $17.41 to its current trading price of $31.99—an 84% increase. However, this bullish momentum is currently experiencing resistance at the $34 level, owing to increased selling pressure in the broader crypto market, particularly as Bitcoin struggles to break past the $35,000 mark. Will this overhead supply lead to a new correction?
Also Read: VanEck Prediction on 10,600% Solana Price Rally By 2030 Triggers Debate
Overhead Supply Hints Upcoming Pullback
- A fake breakout from the $32 resistance sets the SOL price for a minor pullback
- The SOL price may face intense supply pressure $36 mark
- The 24-hour trading volume on the Solana coin is $539 Million, indicating a 43% loss.
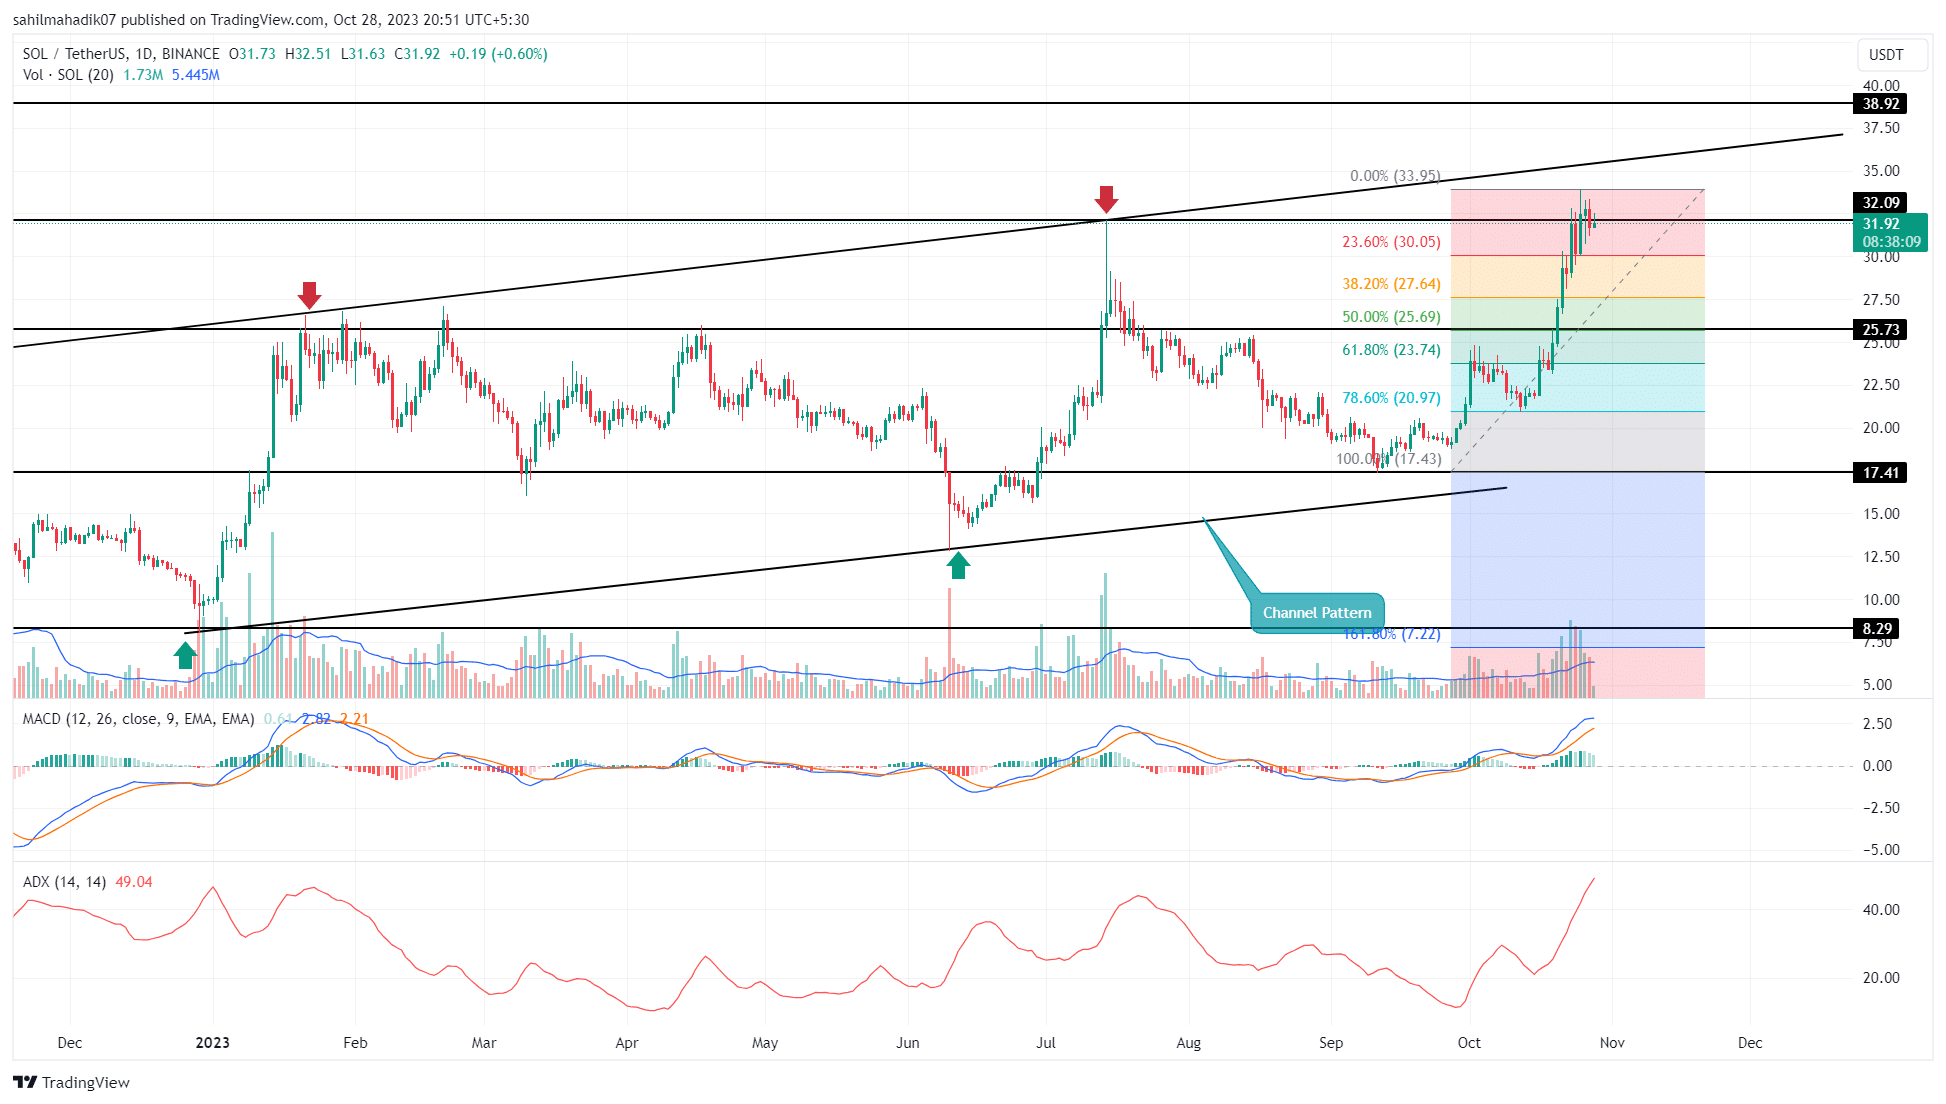
 Source-Tradingview
The daily timeframe chart reveals that the Solana price has been trading within a rising channel pattern, maintaining a long-term uptrend. Under the influence of this pattern and prevailing bullish momentum, the coin price could surge 12% to hit the overhead trendline around $36.
While the asset has recently reclaimed the $32 level, the overhead supply seems to be preventing further upside, suggesting that a minor pullback could be on the cards. By the press time, the SOL price trades at $31.83, with a modest growth of 0.3%
Historical data shows that previous pullbacks never went below the 50% Fibonacci retracement level, indicating that any upcoming pullback could potentially find support around the $25.7 mark to rejuvenate bullish momentum.
Can SOL Price Fall Back to $20?
In the near term, the SOL price appears to be on a bullish trajectory. However, investors should watch for significant selling pressure around the $36 resistance level. The asset has historically faced significant selling pressure upon retesting the upper trendline of its channel pattern, currently situated around $36. Previous interactions with this resistance have led to major corrections, and a similar occurrence could send the price tumbling down to the $20 range.
- Moving Average Convergence Divergence: The MACD (blue) slope moving above the signal line reflects a strong bullish trend in this asset.
- Average Directional Index: The ADX slope at 49% reflects the current recovery may reach maturity and thus a pullback is needed to carry a long-term sustained uptrend.

Why Trust CoinGape
CoinGape has covered the cryptocurrency industry since 2017, aiming to provide informative insights Read more…to our readers. Our journal analysts bring years of experience in market analysis and blockchain technology to ensure factual accuracy and balanced reporting. By following our Editorial Policy, our writers verify every source, fact-check each story, rely on reputable sources, and attribute quotes and media correctly. We also follow a rigorous Review Methodology when evaluating exchanges and tools. From emerging blockchain projects and coin launches to industry events and technical developments, we cover all facets of the digital asset space with unwavering commitment to timely, relevant information.

Related Articles


- Saylor’s Strategy Hints at Bigger Bitcoin Buy Amid $5B Unrealized Losses
- Crypto Market Today: Pi, Pepe, DOGE, and XRP Post Double-Digit Gains
- Trump-Backed American Bitcoin Reserves Surpass 6,000 BTC, Now Worth $425.82M
- Expert Predicts Bitcoin Dip to $49K as ‘Trump Insider’ Whale Dumps 5,000 BTC
- Bitcoin Price Rebounds $70K, Here are the Top Reasons Why?
- Crypto Price Prediction For This Week: Dogecoin, Solana and Cardano
- Bitcoin Price Prediction: How Could Brazil’s Strategic Bitcoin Reserve Proposal Impact BTC?
- 3 Top Reasons Pi Network Price Surging Today (14 Feb)
- XRP Price Prediction Ahead of Potential U.S. Government Shutdown Today
- Bitcoin Price Outlook As Gold And Silver Lose $3.6 Trillion in Market Value
- XRP and Ethereum Price Prediction as Trump Seeks to Lower Key Tariffs


