Solana Price Prediction: Will SOL Shakeoff The Pullback Phase To Head Beyond $100?


Solana Price Prediction: Following the broader market trend, Solana (SOL) is poised for a significant surge, fueled by strong bullish momentum. The October rally ignited a bullish frenzy, breaking a long-term resistance and propelling the price from $21 to the $70 mark within two months. With a 235% jump in that timeframe, SOL now eyes the $100 psychological resistance. Will the bulls overpower this barrier and extend the uptrend, or will a reversal arise?
Also Read: Solana-Based Jito (JTO) Skyrockets 40%, Is $5 Next?
Can Buyers Propel SOL To $100?
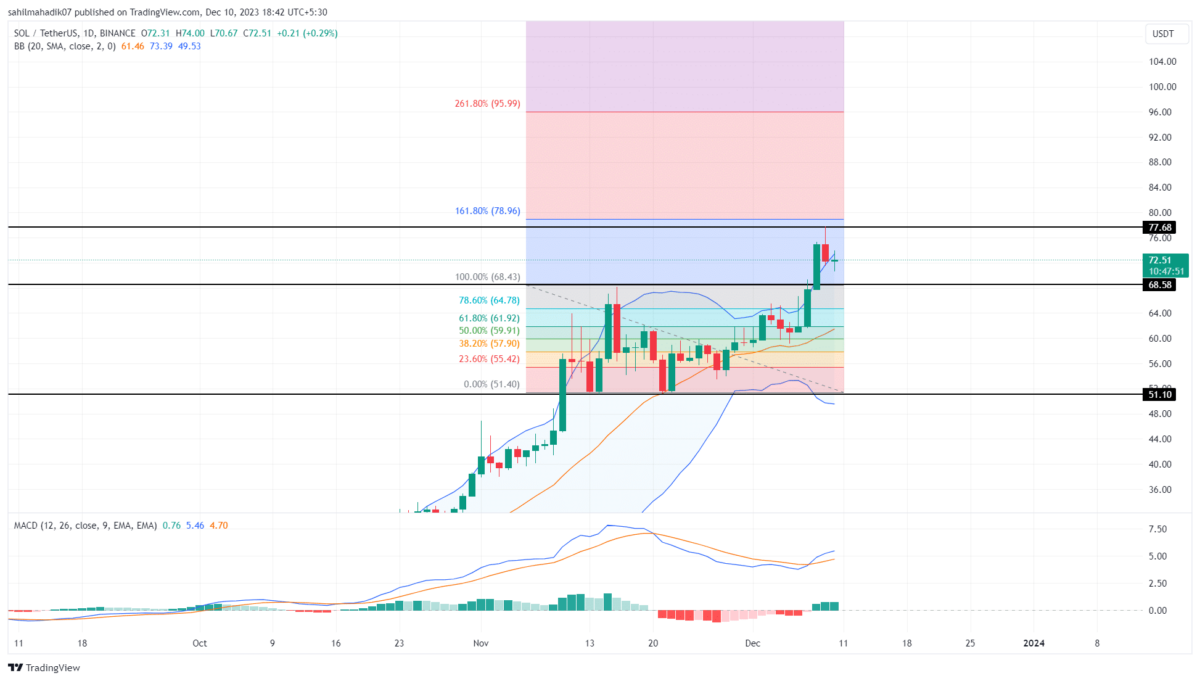
- The SOL price trend shows a short pullback in action as the sellers step in at the overhead resistance at $77.77.
- The pullback phase comes as a retest of the $70 breakout to refuel the prevailing uptrend.
- The intraday trading volume in Solana is $2.1 Billion, indicating a 31% loss.

Riding a wave of bullish momentum, the Solana (SOL) price has skyrocketed over the past two months, experiencing a dramatic turnaround. The meme coin, predominantly displaying bullish candles, has finally breached the $75 mark in a remarkable eight-week climb.
Starting the month at $59.31, the SOL price experienced a sharp boost as the overall market bounced back. This altcoin approaches the overhead resistance zone, leading to a 21.15% jump and reaching a 52-week high of $77.77.
Currently, the SOL price trades at $71.73 and forms a bearish candle of 0.83% fall following the 3.62% drop last night. Teasing a deeper pullback, the retest gains momentum and warns of a drop under the $66 mark if the sellers get serious.
Pullback Threats Minor Crash For Solana
The Solana (SOL) recovery faces a new resistance above the psychological level at $75, resulting in a higher price rejection and teasing a trend reversal. However, the trend-based Fibonacci retracement labels the ongoing pullback as a retest. Further, the buyers are expected to halt the downtrend at $70 and potentially drive the uptrend to $100 before 2023 ends.
- Bollinger Bands: The uptick in the upper boundary Bollinger Band showcases the buyers are aggressive in nature.
- Moving Average Convergence Divergence: The MACD and signal lines give a positive crossover and signal a trend reversal for Solana, increasing the chances of reaching $100.

Why Trust CoinGape
CoinGape has covered the cryptocurrency industry since 2017, aiming to provide informative insights Read more…to our readers. Our journal analysts bring years of experience in market analysis and blockchain technology to ensure factual accuracy and balanced reporting. By following our Editorial Policy, our writers verify every source, fact-check each story, rely on reputable sources, and attribute quotes and media correctly. We also follow a rigorous Review Methodology when evaluating exchanges and tools. From emerging blockchain projects and coin launches to industry events and technical developments, we cover all facets of the digital asset space with unwavering commitment to timely, relevant information.

Related Articles


- Trump’s Truth Social Files For Bitcoin, Ethereum, Cronos Crypto ETFs Amid Institutional Outflows
- Trump Tariffs: U.S. Supreme Court Sets February 20 for Potential Tariff Ruling
- Brazil Targets 1M BTC Strategic Reserve to Rival U.S. Bitcoin Stockpile
- Breaking: U.S. CPI Inflation Falls To 4-Year Low Of 2.4%, Bitcoin Rises
- Bitget Launches Gracy AI For Market Insights Amid Crypto Platforms Push For AI Integration
- Bitcoin Price Outlook As Gold And Silver Lose $3.6 Trillion in Market Value
- XRP and Ethereum Price Prediction as Trump Seeks to Lower Key Tariffs
- Solana Price Prediction as $2.6 Trillion Citi Expands Tokenized Products to SOL
- Bitcoin Price Could Fall to $50,000, Standard Chartered Says — Is a Crash Coming?
- Cardano Price Prediction Ahead of Midnight Mainnet Launch
- Pi Network Price Prediction as Mainnet Upgrade Deadline Nears on Feb 15


