Tezos Price Analysis: Approaches $1.70 Amid Sustained Buying; Are You Holding?


The Tezos price analysis shows a bullish bias for the day. The price is not in bullish momentum for the day, in fact, the price recovery is continuous since August 20.
Now, it is interesting to watch if the same momentum will continue or if it’s a bullish trap.
XTZ is in bullish momentum despite the overall bearish pressure. As of now, the price is making a higher high and higher low. But, the pattern is distorted after forming the swing high of $2.03 on August 17. The buyers formed a double bottom structure near $1.54, resulting in a bounce back.
- Tezos price edges higher on Thursday following five days of consolidation.
- The price faces strong resistance near $1.65 pausing the threat of further recovery.
- A bullish formation on the short-time frame added to the bullish theory.
Tezos price looks signs of recovery
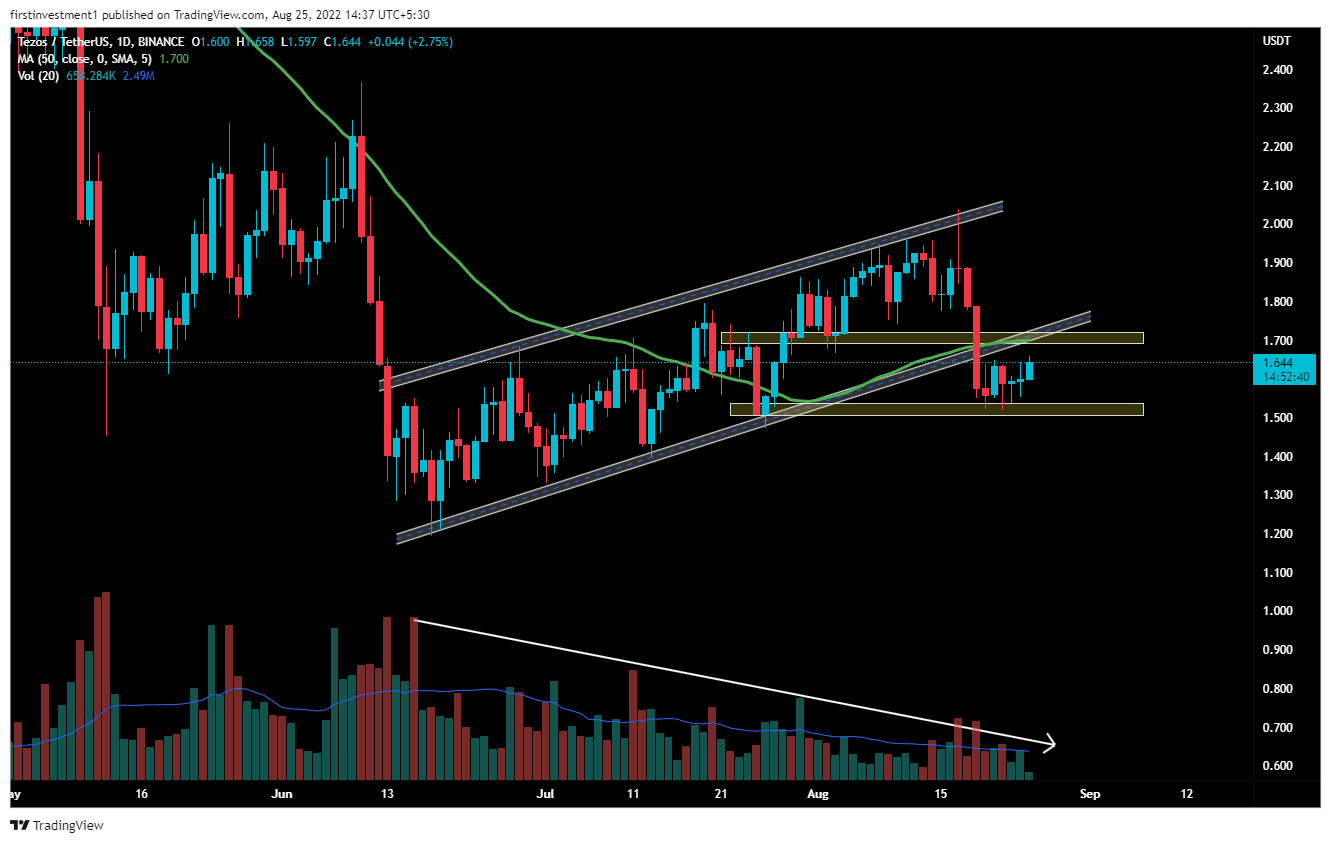
On the daily chart XTZ, recently gave a breakdown of a bearish “Flag & pole” Pattern, indicating weakness around the overall look, along with a clear breakdown of the 50-day exponential moving average.
The price broke the pattern’s support and produces a bearish breakdown. Along with above-average volumes. The volumes were declining, with the rising price of an XTZ, which implies a worrisome. When the market is rising while volume is declining, big money is not the one buying, more likely slowly exiting positions.
The price has taken good support near the previous swing low, making higher lows on the daily chart. The price can expect some pullback from this recent support of up to $1.72, which will now act as a resistance.
On the other hand, a daily close below the session’s low would negate the forward-looking bias. In that case, the price could test $1.52.
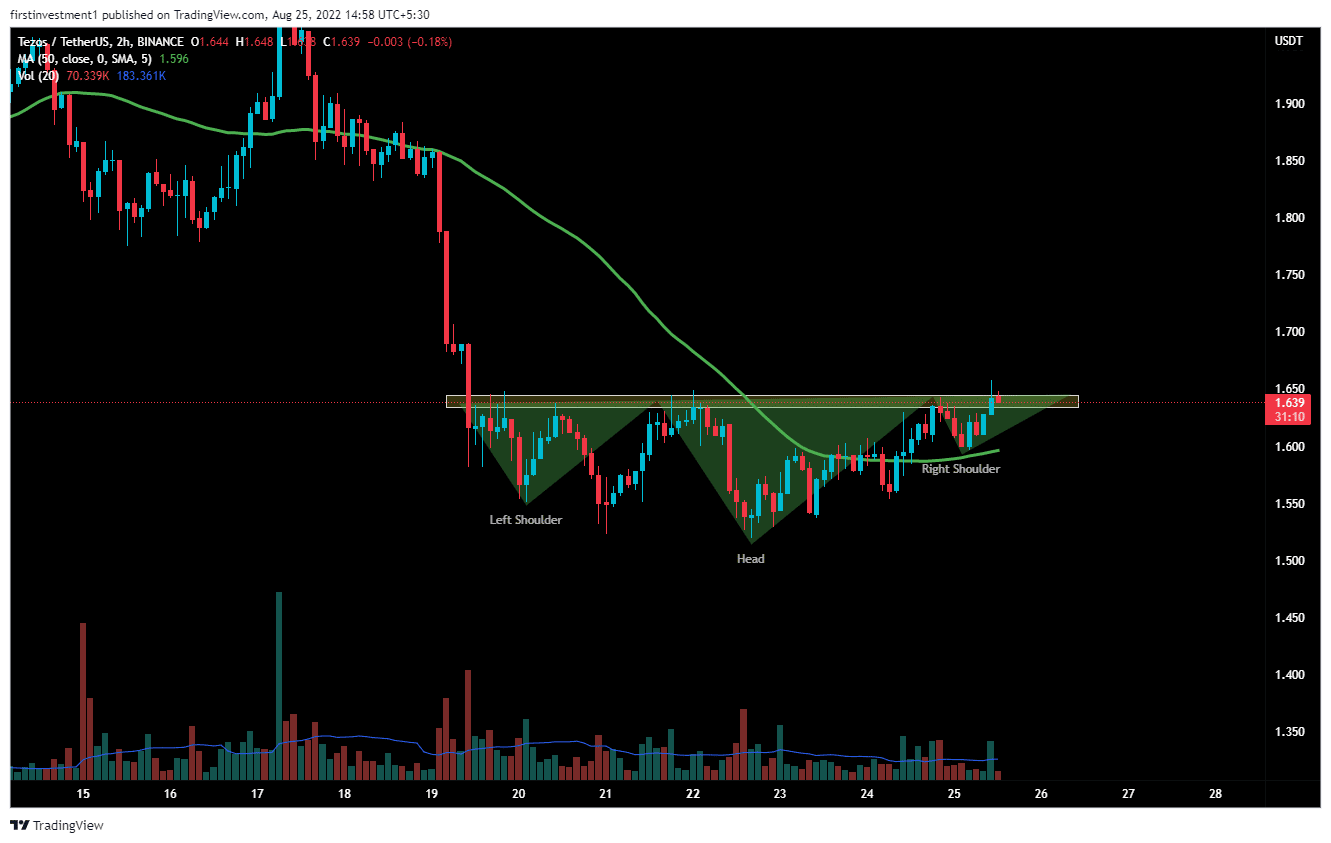
On the two-hour time frame, the formation of a bullish “Head & Shoulder” pattern suggests a pullback in the price. If the price gave a closing above $1.65 on the hourly chart, we can expect a bullish momentum of up to $1.72.
The nearest support is the nearest swing low, $1.52, whereas the nearest resistance is $1.720. Additional buying interest could push the price higher toward $1.90.
XTZ is sideways to slightly bullish on all time frames. Above $1.72 closing on the daily time frame, we can put a trade on the buy side.
As of press time, XTZ/USD is reading at $1.64, up 2.34% for the day. The trading volume in the past 24 hours rose marginally to $42,097,197 according to CoinMarketCap data.

Why Trust CoinGape
CoinGape has covered the cryptocurrency industry since 2017, aiming to provide informative insights Read more…to our readers. Our journal analysts bring years of experience in market analysis and blockchain technology to ensure factual accuracy and balanced reporting. By following our Editorial Policy, our writers verify every source, fact-check each story, rely on reputable sources, and attribute quotes and media correctly. We also follow a rigorous Review Methodology when evaluating exchanges and tools. From emerging blockchain projects and coin launches to industry events and technical developments, we cover all facets of the digital asset space with unwavering commitment to timely, relevant information.