Tezos Price Analysis: XTZ Bounces Back Toward $1.60; Is Correction Over?


The Tezos price analysis indicates a modest gain amid discount buying opportunities. The price is fetching some fresh buying interest as the sellers seemed exhausted near $1.50.
However, the upside is capped at $1.60 in the short-term time frame. The longer the price stayed below this level, the more selling pressure will build up in the coin.
- Tezos price is consolidating with a mildly bullish bias.
- The downside risk remained capped below $1.54.
- XTZ’s current market structure favor bears.
Tezos price looks for an upside reversal
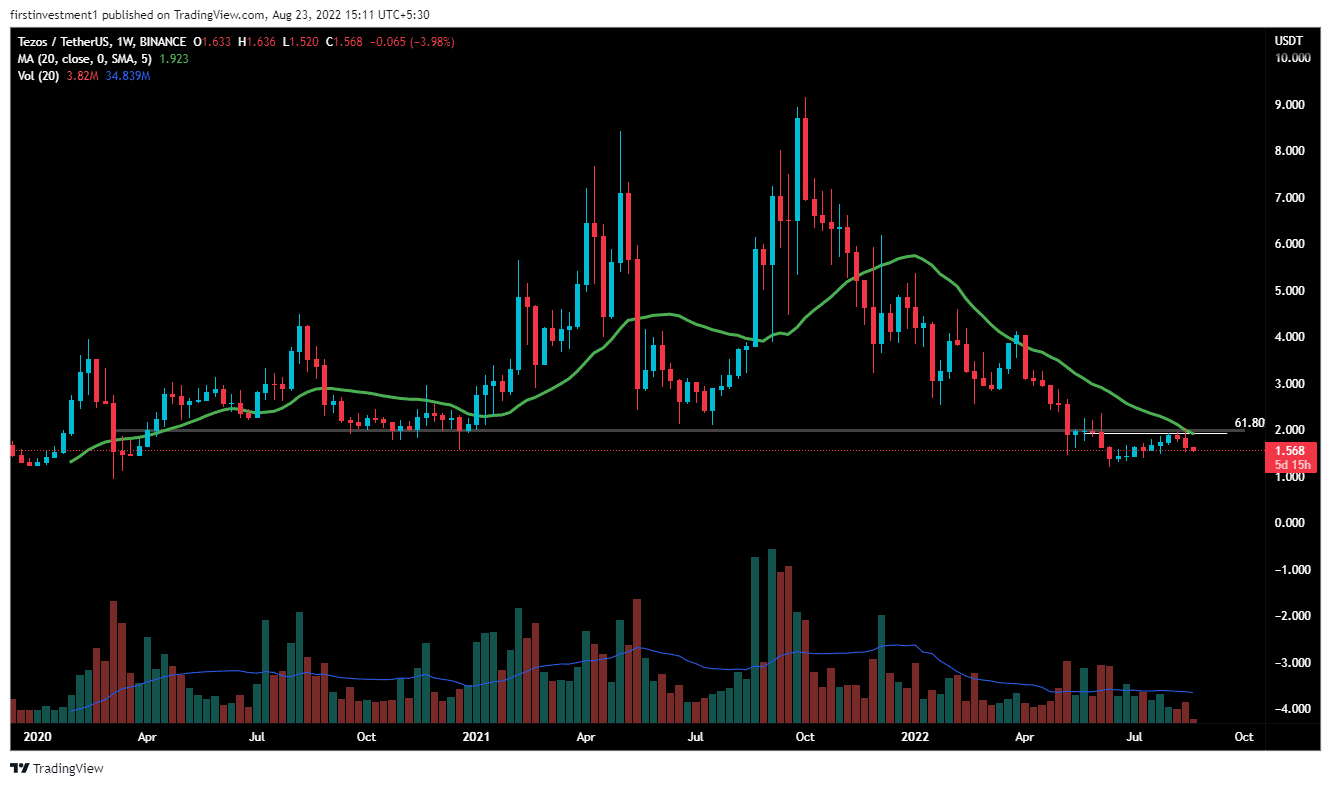
On the weekly chart, the XTZ price closed above $2.0 for the first time on April 13, 2020, and since then the price had made a high of $9.2, with an upside of more than 350% return.
However, XTZ broke the support of two-year on n May 16, 2022, and gave a closing below this level on the weekly chart, & then started to fall from there up to $1.22.
This week, finally the price tested the $2.0 level once again, but couldn’t sustain above that level, facing heavy resistance, which was once acting as a support. The price faces resistance at the 20-day exponential moving average. Along with a 61.8% Fibonacci retracement, which will act as immediate resistance to this week
Now, if the price on the weekly chart, closes below $1.50, then there is a high probability of the price going up to its recent swing low, which is $1.22.
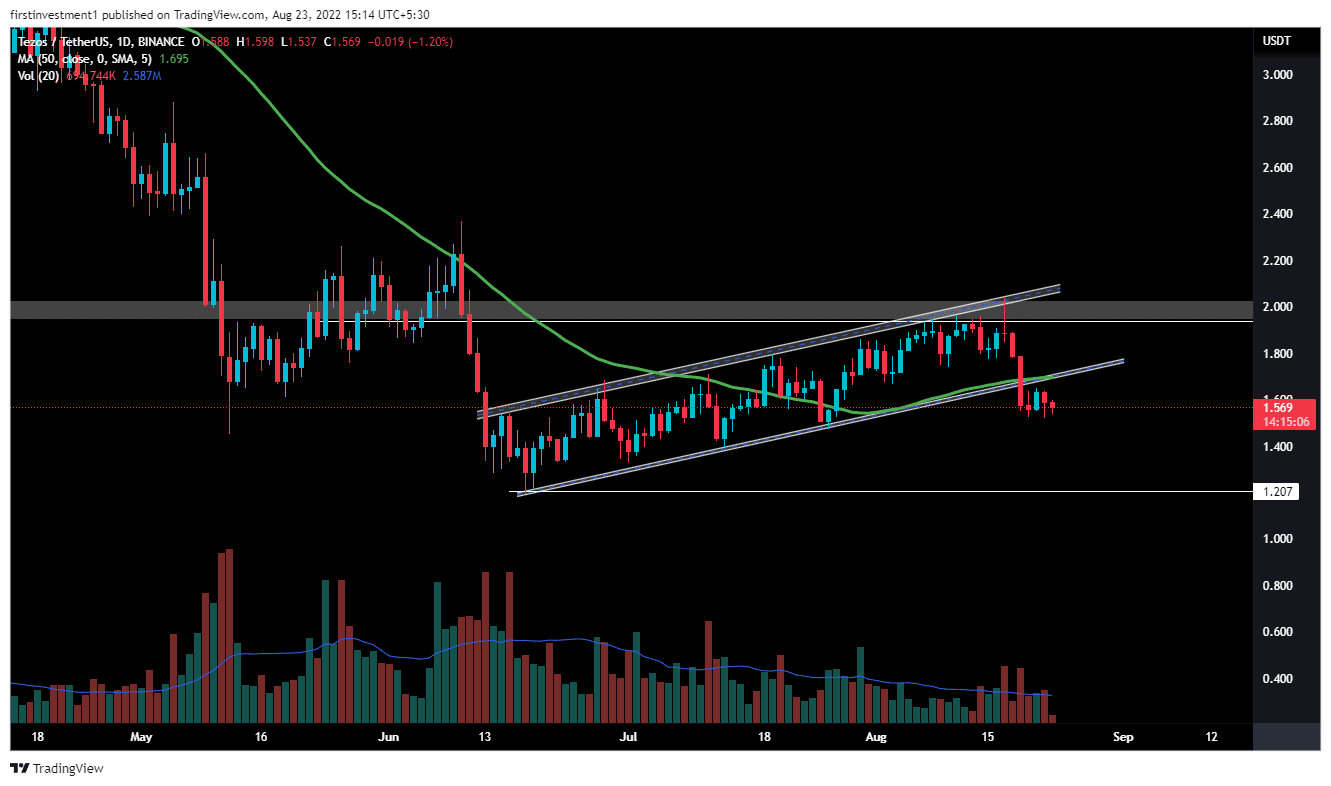
On the daily chart, XTZ produces a breakout breakdown of the bearish “Flag & pole” Pattern, indicating weakness around the overall look. This also coincides with the breach of the 50-day exponential moving average.
Tezo’s price broke the pattern’s support level. Along with rising volumes as compared to the previous volumes. The volumes were declining, with the rising price of an XTZ, which implies concerns for the buyers.
When the market is rising while volume is declining, big money is not the one buying, more likely slowly exiting positions.
According to this pattern, The expected fall in XTZ could be around $1.50. To find targets for the Flag pattern, the Fibonacci Extension indicator is used, which gives us more than 70% accurate targets.
The nearest support is the nearest swing low, which is $1.54, whereas the nearest resistance is at $1.70. There is a higher probability of the price to breaks its support level on a lower level. “Sell on rising” opportunity is the best course of plan we can go with.
On the other hand, a daily close above the $1.60 level could invalidate the bearish outlook. And the price can move toward $1.70 followed by the psychological $1.80 mark.
XTZ is bearish on all time frames. Below $1.54 closing on the hourly time frame, we can put a trade on the sell side.
As of publication time, XTZ/USD is reading at $1.59, with 0.45% gains for the day.

Why Trust CoinGape
CoinGape has covered the cryptocurrency industry since 2017, aiming to provide informative insights Read more…to our readers. Our journal analysts bring years of experience in market analysis and blockchain technology to ensure factual accuracy and balanced reporting. By following our Editorial Policy, our writers verify every source, fact-check each story, rely on reputable sources, and attribute quotes and media correctly. We also follow a rigorous Review Methodology when evaluating exchanges and tools. From emerging blockchain projects and coin launches to industry events and technical developments, we cover all facets of the digital asset space with unwavering commitment to timely, relevant information.

Related Articles


- CLARITY Act: Banks and Crypto Make Progress Following “Constructive” Dialogue at White House Meeting
- Expert Warns Bitcoin Bear Market Just In ‘Phase 1’ as Glassnode Flags BTC Demand Exhaustion
- SEC Chair Reveals Regulatory Roadmap for Crypto Securities Amid Wait for CLARITY Act
- ProShares Launches First GENIUS Act Focused Money Market ETF, Targeting Ripple, Tether, Circle
- BTC Price Falls as Initial Jobless Claims Come In Below Expectations
- Top 3 Price Predictions Feb 2026 for Solana, Bitcoin, Pi Network as Odds of Trump Attacking Iran Rise
- Cardano Price Prediction Feb 2026 as Coinbase Accepts ADA as Loan Collateral
- Ripple Prediction: Will Arizona XRP Reserve Boost Price?
- Dogecoin Price Eyes Recovery Above $0.15 as Coinbase Expands Crypto-Backed Loans
- BMNR Stock Outlook: BitMine Price Eyes Rebound Amid ARK Invest, BlackRock, Morgan Stanley Buying
- Why Shiba Inu Price Is Not Rising?


