What’s Ahead for ETH Price as it Slips Below $1700?


The cryptocurrency market experienced a notable event on August 17th, marked by a sell-off in the leading digital currency, Bitcoin. This sell-off was prompted by SpaceX’s decision to divest its Bitcoin holdings, amplifying selling pressure across the crypto space. Consequently, Ethereum, another prominent cryptocurrency, saw a substantial outflow, leading to a significant breach of a longstanding support trendline. The breach of this support suggests that the ETH price could be poised for an extended correction phase.
Also Read: Ethereum Market Undervaluation Could Confirm Major Bullish Move
ETH Price Daily Chart: Key Points
- The Ethereum fear and greed index at 27% reflects negative sentiment in the market
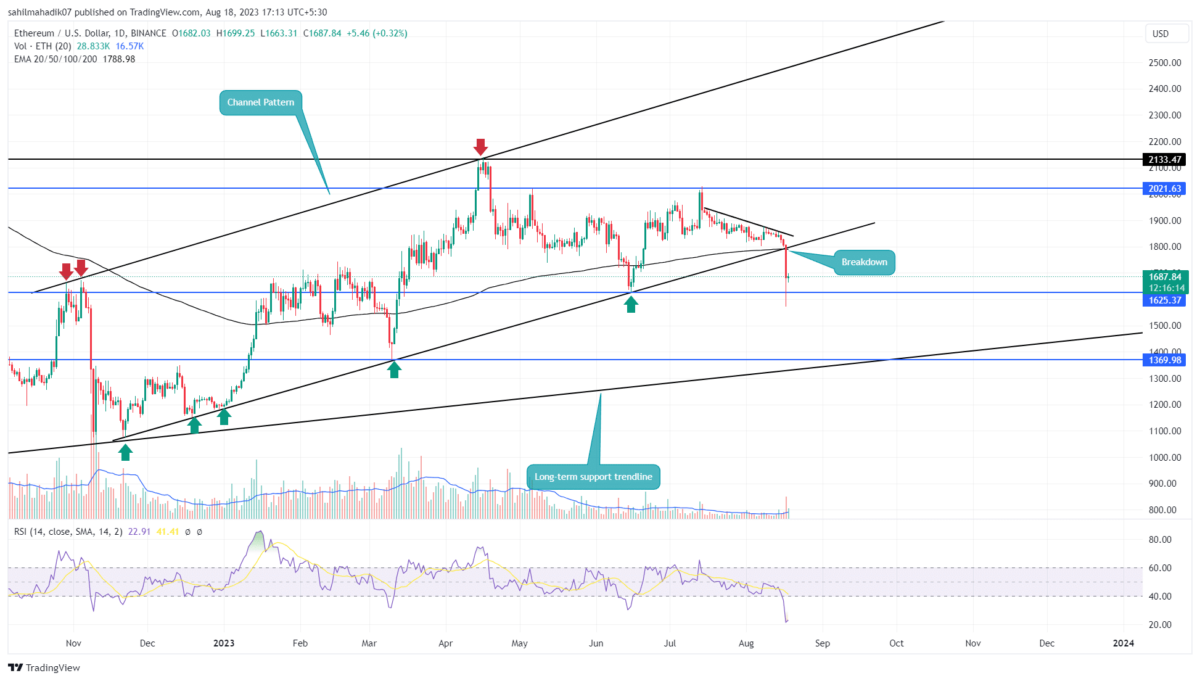
- A breakdown below the support trendline of the channel pattern sets the prices for an 18% drop
- The intraday trading volume in Ether is $16.5 Billion, indicating a 178 gain.
 Source- Tradingview
Over the past nine months, the second largest cryptocurrency Ethereum experienced a study uptrend using a parallel channel pattern. During this period, the lower trendline bolstered buyers to accumulate at price dips.
However, on August 17th, the Ethereum price dropped 6.8% and breached the dynamic support. This breakdown could bolster change in market sentiment from buying on dips to selling on rallies.
If the coin price managed to sustain below the pierced support, the selling pressure could push the price to $1625, followed by $1400.
A possible crackdown of the $1625 swing low will also violate Dow theory of uptrend, giving additional confirmation of a prolonged downfall.
Should You Consider Selling Ethereum Now?
Despite the massive breakdown mentioned above, the ETH price showcased long-tail rejection in the daily chart at $1625 support. This buying could be associated with the market participants entering correction dips. Therefore, a minor pullback is expected which could retest the breached support trendline. The coin price sustainability below the ascending trendline could offer a short-selling opportunity to interested traders
- Exponential Moving Average: The coin price breakdown below the 200-day EMA reflects a negative trend in the market.
- Relatives strength index: The daily RSI slope at 21% reflects an oversold Ethereum price, increasing the potential of a bullish pullback.

Why Trust CoinGape
CoinGape has covered the cryptocurrency industry since 2017, aiming to provide informative insights Read more…to our readers. Our journal analysts bring years of experience in market analysis and blockchain technology to ensure factual accuracy and balanced reporting. By following our Editorial Policy, our writers verify every source, fact-check each story, rely on reputable sources, and attribute quotes and media correctly. We also follow a rigorous Review Methodology when evaluating exchanges and tools. From emerging blockchain projects and coin launches to industry events and technical developments, we cover all facets of the digital asset space with unwavering commitment to timely, relevant information.

Related Articles


- BlackRock Amends Filing For Staked Ethereum ETF, Eyes 18% of Staking Rewards From ETH Fund
- Arizona Advances Bitcoin, XRP Reserve Bill Using Seized Crypto Assets
- Bitcoin ETF Update: BlackRock Signals BTC Sell-Off as Kevin O’Leary Warns of Decline In Institutional Demand
- Breaking: Tom Lee’s BitMine Buys 45,759 ETH as CryptoQuant Flags Potential Bottom For Ethereum
- Breaking: U.S. CFTC Moves To Defend Polymarket, Kalshi From Regulatory Crackdown By State Regulators
- Pi Network Price Beats Bitcoin, Ethereum, XRP as Upgrades and Potential CEX Listing Fuels Demand
- 5 Things Dogecoin Price Needs to Hit $0.20 in Feb 2026
- Bitcoin Price Prediction as Experts Warns of Quantum Risks
- Dogecoin, Shiba Inu, Pepe Coin Price Predictions As BTC Crashes Below $68k
- Ethereum Price Outlook as Harvard Shifts Focus from Bitcoin to ETH ETF
- HOOD and COIN Stock Price Forecast as Expert Predicts Bitcoin Price Crash to $10k


