What’s Ahead for XRP Price After a Break Below $0.5?


In the midst of a faltering altcoin market, the XRP price encountered a pronounced pullback after facing resistance at the $0.55 mark on October 3rd. Over the past week, this downward shift resulted in a 9.5% dip, dragging the cryptocurrency’s value down to $0.49. Alarmingly, this descent has led sellers to breach the supportive boundary of an ascending triangle pattern on its chart, hinting at a potentially deeper correction ahead.
Also Read: Ripple Bids Farewell to CFO, Is Leaders Exodus Returning?
Will the XRP Price Fall to $0.42?
- A breakdown from an ascending triangle pattern hints at accelerated selling pressure.
- The falling XRP price may witness significant support around $0.458 and $0.42.
- The intraday trading volume in the XRP is $752.2 Million, indicating a 1.62% loss.
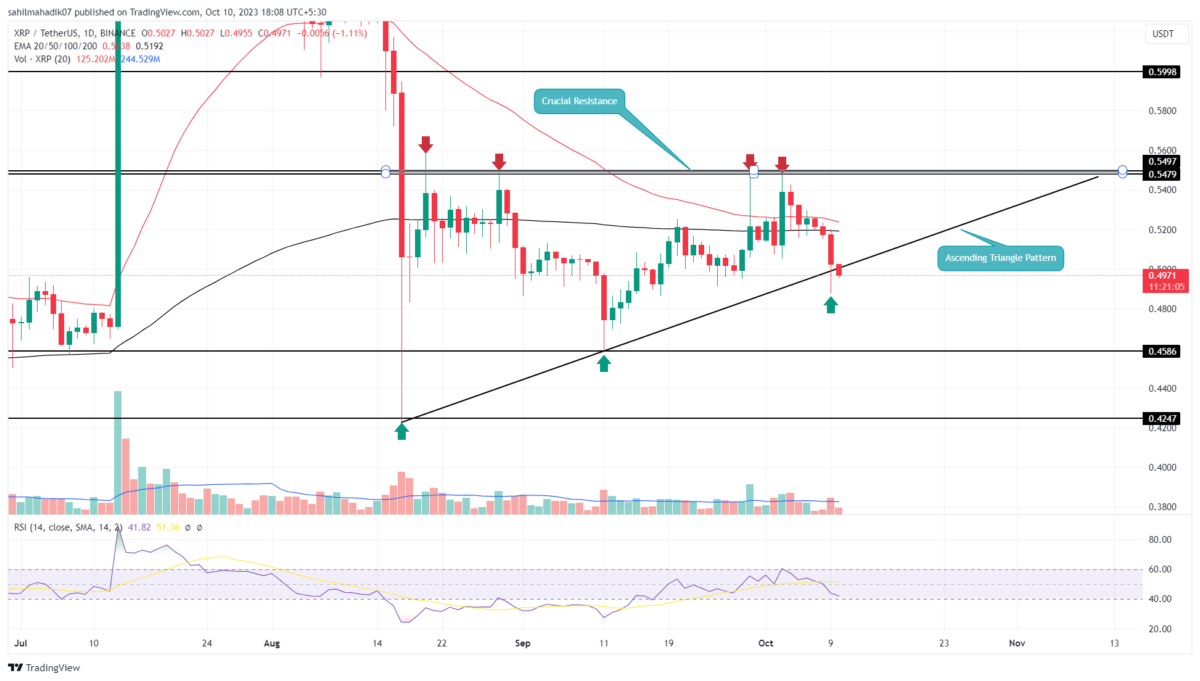
 Source: Tradingview
Amidst the last 50 days of consolidation, the XRP price shows the formation of an ascending triangle pattern in the daily time frame chart. Typically, this pattern is projected as a bullish pattern, which promotes a significant rally after the breakout of its neckline.
Within the last two months, the coin price has faced four reversals from the $0.55 neckline, indicating it has a stronger resistance zone. With the last reversals from this resistance on October 3rd and weakness across the broader market, the XRP price has broken below this pattern’s ascending support trendline.
If the daily candle manages to close below the breached support, the sellers would gain an extra edge to pressurize coins to lower prices. The post-breakdown fall would plunge the price 7.5% down to hit the nearest support at $0.458, followed by the $0.42 mark.
[converter id=”xrp-xrp” url=”https://coingape.com/price/converter/xrp-to-usd/?amount=1″]
Should You Go Bearish on XRP Coin?
On October 9th, the XRP Price showed a failed attempt to breach the lower support trendline of the ascending triangle pattern. Despite the back of a huge volume, the coin price could not sustain below the trendline which resulted in a long tail rejection candle. This daily candle reflects the sellers would need even higher momentum to break past this support. Thus, it is crucial for players to wait for a candle to close to confirm a bearish breakdown. If by the day’s end, the XRP Price surges back above the lower trendline, the coin price would likely continue the consolidation trend within the triangle pattern.
- Relative Strength Index: The daily RSI slope above 40% reflects the buyer’s sufficient momentum for a price reversal.
- Exponentially moving average: The current prices drop below the 200-day EMA slope indicating the market sentiment is bearish.

Why Trust CoinGape
CoinGape has covered the cryptocurrency industry since 2017, aiming to provide informative insights Read more…to our readers. Our journal analysts bring years of experience in market analysis and blockchain technology to ensure factual accuracy and balanced reporting. By following our Editorial Policy, our writers verify every source, fact-check each story, rely on reputable sources, and attribute quotes and media correctly. We also follow a rigorous Review Methodology when evaluating exchanges and tools. From emerging blockchain projects and coin launches to industry events and technical developments, we cover all facets of the digital asset space with unwavering commitment to timely, relevant information.
24 Hours volume
$2.43B
Market Cap
$93.61B
Max Supply
100B

Related Articles


- Expert Predicts Bitcoin Dip to $49K as ‘Trump Insider’ Whale Dumps 5,000 BTC
- Bitcoin Price Rebounds $70K, Here are the Top Reasons Why?
- Crypto Market Weekly Recap: Crypto Bill White House Meeting, Binance Buys $1B BTC, and More (9- Feb 13)
- TRUMP Coin Pumps 5% as Canary Capital Amends ETF Filing With New Details
- Crypto Prices Surge Today: BTC, ETH, XRP, SOL Soar Despite US Government Shutdown
- Crypto Price Prediction For the Week Ahead: Dogecoin, Solana and Cardano
- Bitcoin Price Prediction: How Could Brazil’s Strategic Bitcoin Reserve Proposal Impact BTC?
- 3 Top Reasons Pi Network Price Surging Today (14 Feb)
- XRP Price Prediction Ahead of Potential U.S. Government Shutdown Today
- Bitcoin Price Outlook As Gold And Silver Lose $3.6 Trillion in Market Value
- XRP and Ethereum Price Prediction as Trump Seeks to Lower Key Tariffs


