What’s Next for LUNC Price Amid Current Uncertainty; $0.0001 or $0.000082?


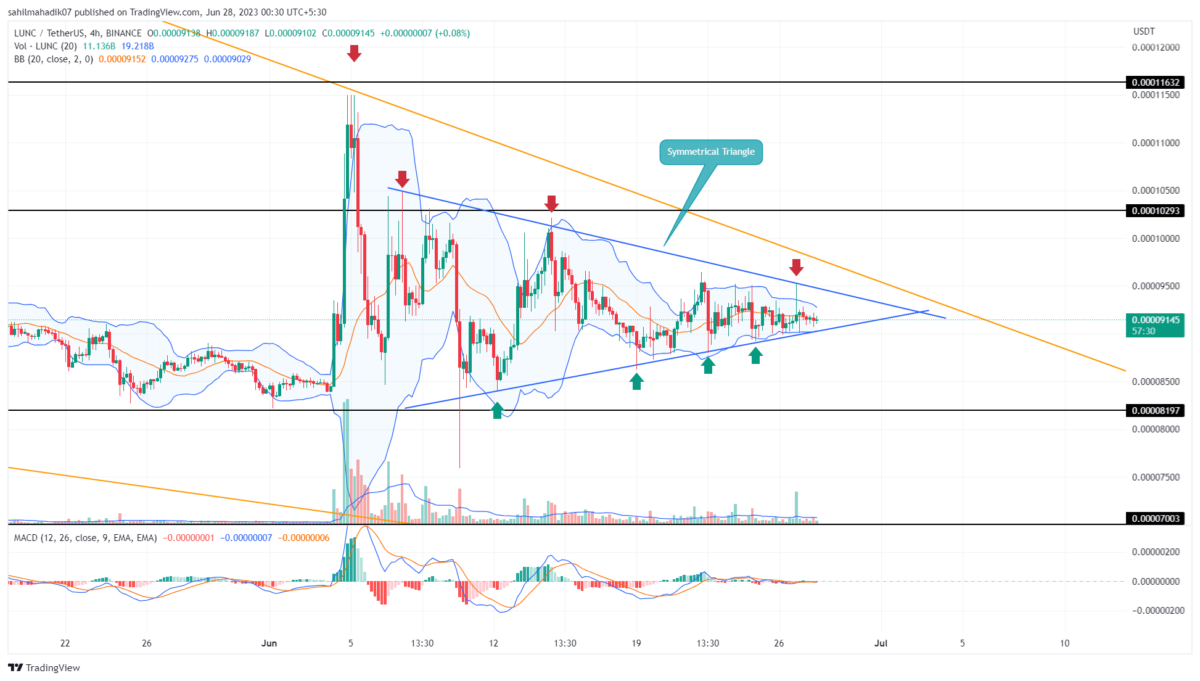
Decoupling from the later June recovery in the crypto market, the LUNC price has been in a sideways trend for over three weeks. The daily candle showcasing short bodies with longer wicks on either side indicates uncertainty among market participants. However, a closer look at the lower time frame chart project, despite the market indecisiveness, the LUNC price strictly follows the formation of a symmetrical triangle pattern. Here’s how this pattern could assist traders to determine the near future trend.
Also read: Terra Luna Classic To Burn 900 Mln LUNC Reminted From Binance, Total Burn 65 Bln
LUNC Price Daily Chart:
- The area encompassed by the triangle pattern can be considered a “no-trading zone.”
- The triangle pattern breakout would intensify the underlying bullish momentum
- The intraday trading volume of the LUNC coin is $32.5 million, indicating a 40.2% loss
 (Source: Tradingview)
For the past three weeks, the LUNC price has been resonating between the converging trendline of the triangle pattern. In theory, this pattern is a continuation pattern that triggers a brief period of consolidation before continuing with the prior trendline.
Currently, the LUNC price trades at $0.0000916 and gradually gets close to the triangle pattern’s peak. The narrow range available will soon lead to a breakout that could offer a trading opportunity to interested market participants.
A possible breakdown below the pattern’s support trendline will accelerate the selling pressure and plunge the altcoin 10% to hit the next significant support of $0.0000822.
Will LUNC Price Recovery to the $0.0001 Mark?
Two significant resistance are currently standing in the way of LUNC’s price to obtain a sustained recovery. These resistances are the triangles pattern upper trendline and a long-coming downsloping trendline. The buyers need to breach these resistances to gain suitable support for the future. The potential breakout will surge the coin price to $0.00000103 and $0.00000116.
- Moving Average Convergence/Divergence: A flattish slope of the signal(orange) and MACD(blue) line project uncertainty in traders.
- Bollinger Bands: The tightening of Bollinger Band indicators intensifies the prevailing market sentiment’s uncertainty and emphasizes the necessity for a breakout to ascertain future movement.

Why Trust CoinGape
CoinGape has covered the cryptocurrency industry since 2017, aiming to provide informative insights Read more…to our readers. Our journal analysts bring years of experience in market analysis and blockchain technology to ensure factual accuracy and balanced reporting. By following our Editorial Policy, our writers verify every source, fact-check each story, rely on reputable sources, and attribute quotes and media correctly. We also follow a rigorous Review Methodology when evaluating exchanges and tools. From emerging blockchain projects and coin launches to industry events and technical developments, we cover all facets of the digital asset space with unwavering commitment to timely, relevant information.

Related Articles


- Saylor’s Strategy Hints at Bigger Bitcoin Buy Amid $5B Unrealized Losses
- Crypto Market Today: Pi, Pepe, DOGE, and XRP Post Double-Digit Gains
- Trump-Backed American Bitcoin Reserves Surpass 6,000 BTC, Now Worth $425.82M
- Expert Predicts Bitcoin Dip to $49K as ‘Trump Insider’ Whale Dumps 5,000 BTC
- Bitcoin Price Rebounds $70K, Here are the Top Reasons Why?
- Crypto Price Prediction For This Week: Dogecoin, Solana and Cardano
- Bitcoin Price Prediction: How Could Brazil’s Strategic Bitcoin Reserve Proposal Impact BTC?
- 3 Top Reasons Pi Network Price Surging Today (14 Feb)
- XRP Price Prediction Ahead of Potential U.S. Government Shutdown Today
- Bitcoin Price Outlook As Gold And Silver Lose $3.6 Trillion in Market Value
- XRP and Ethereum Price Prediction as Trump Seeks to Lower Key Tariffs


