Will Ethereum Price Hit $2,000 Next Week?


Ethereum price remains sidelined for the day. The price has appreciated by nearly 15% in the last four days, indicating a probable upside continuation outside of the consolidation.
- Ethereum price trades with a positive bias in a very tight range.
- The $1,720 remained a critical challenge for the bulls to attack.
- However, the rising formation on the weekly chart suggests a bullish bias.
Ethereum price turns north
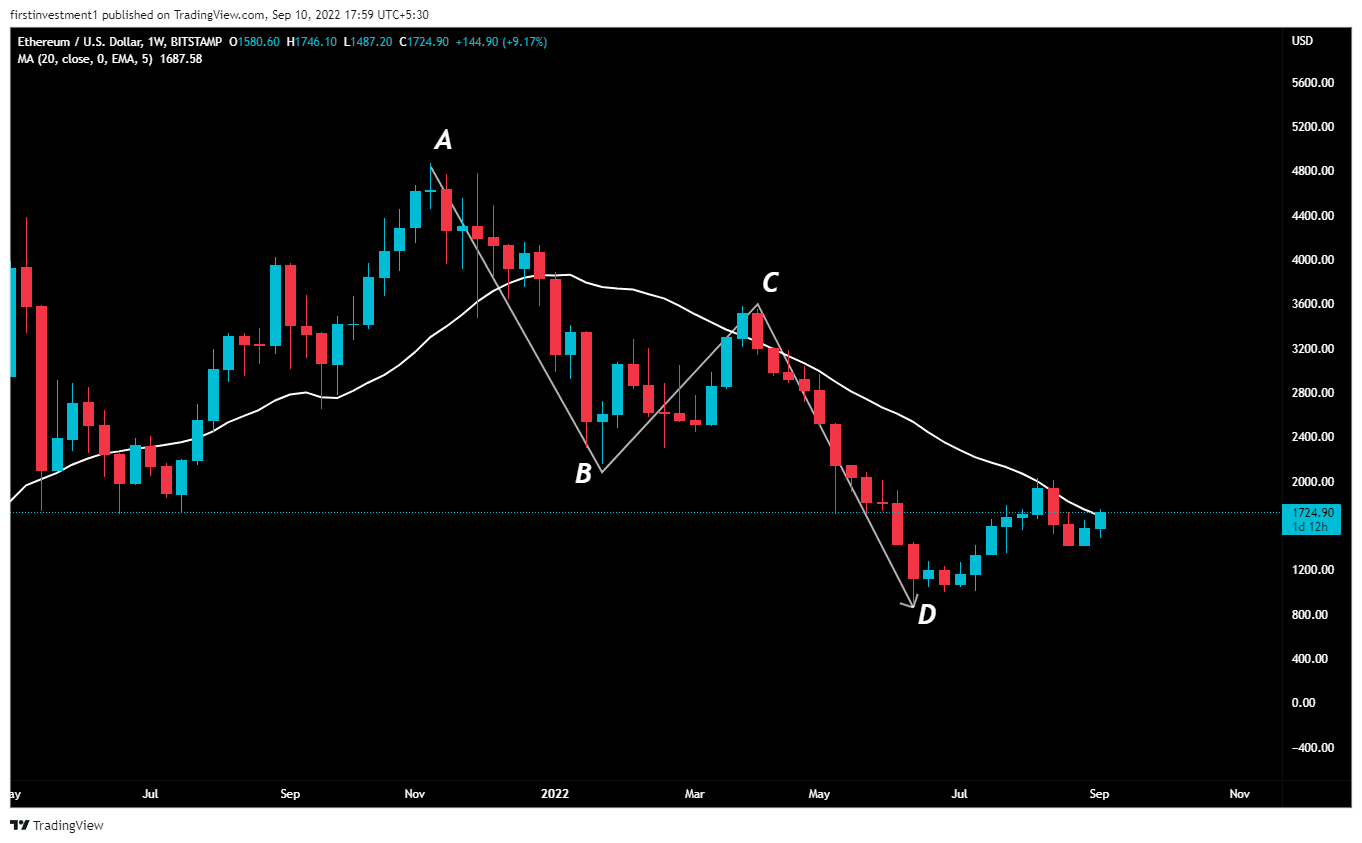
A miraculous recovery in Ethereum was observed from the swing lows of $882. ETH price on the weekly chart formed a Bullish “ AB=CD” Pattern. The bullish ABCD pattern forms during a downward indicate a potential price reversal, meaning the beginning of a bullish trend.
The three price swings include a drop in price from the A to B level, a correction from B to C level, and another decrease from point C to D level. Ultimately, it creates a zigzag pattern where the D point is the ultimate entry point.
According to this pattern, we can set profit target at ($2,200) or ($3,550). However, in case a strong move is identified, the Fibonacci retracement levels could also be used in the same timeframe.
On the lower side, a breaking of the stop-loss order at $1,500, the price could drop toward $1.200.
On the weekly chart, Ethereum bulls face a challenge near the 20-day exponential moving average at $1,690. As the price produces a daily close above this level then we witnessed a good bullish momentum to achieve the mentioned targets.
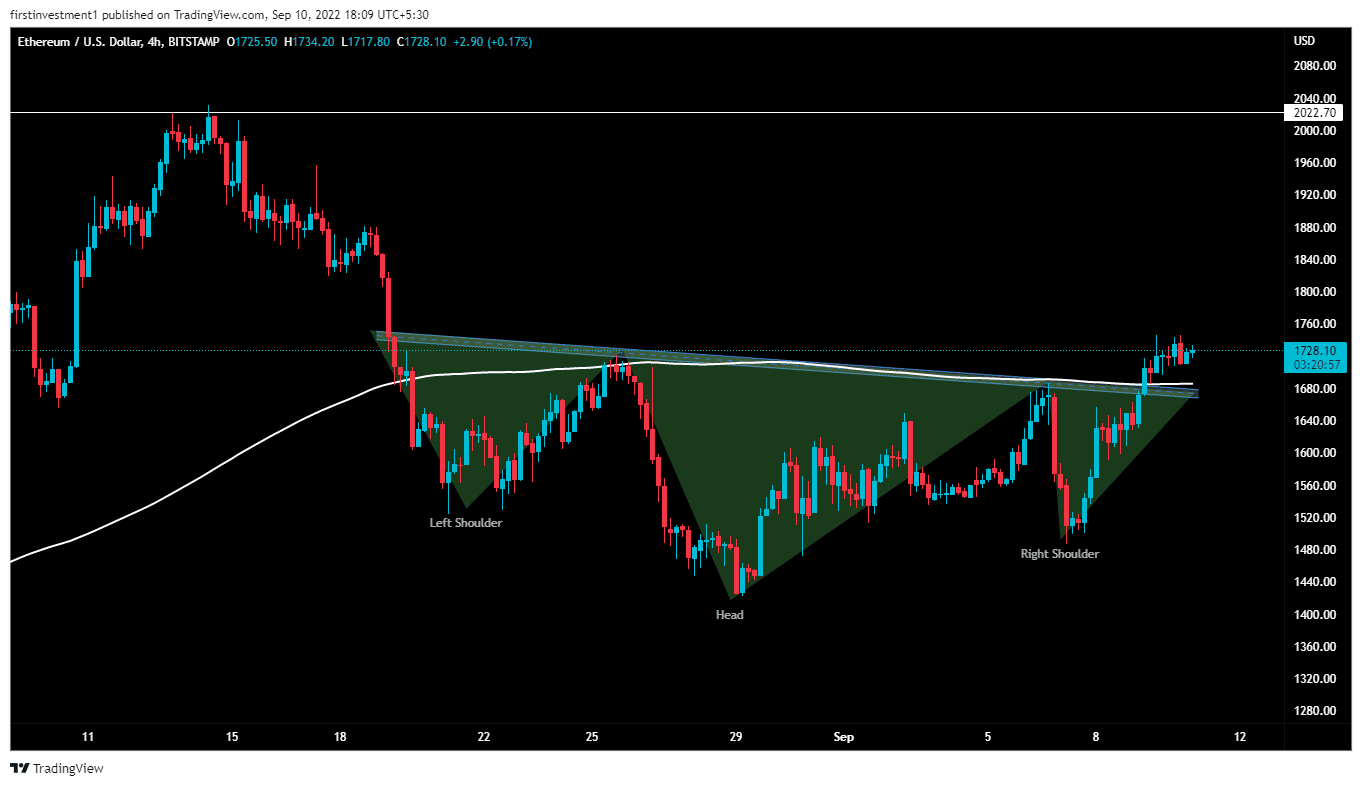
Ethereum price on the four-hour chart gave a breakout of an Inverse “Head & Shoulder” pattern. The coin after falling from $2,030 to $1,423, recovered swiftly, & now even formed a reversal Pattern.
Also read: https://What Are Odds Of Ethereum Merge Failure?: Experts Predict
The price gave a breakout of its pattern’s neckline along with the resistance of the 200-day exponential moving average.
If the price is able to sustain above that given level on the daily chart, then we can expect a good bullish momentum of up to $2020
The nearest support could be located near $1,570, whereas the most comparable resistance is $1,750. There is a higher probability of the price to place aggressive bids.
In contrast, a shift in the bearish sentiment could ruin any bullish outlook for the altcoin. A break below the $1,570 level would temper bullish sentiment. And the price could drop to $1,420.
Ethereum price analysis is bullish on multiple time frames. With a decisive break above $1,750 on the hourly time frame, a buy trade is the most feasible course of action for side-lined investors.
As of publication time, ETH/USD is reading at $1,720 with 0.6% gains.

Why Trust CoinGape
CoinGape has covered the cryptocurrency industry since 2017, aiming to provide informative insights Read more…to our readers. Our journal analysts bring years of experience in market analysis and blockchain technology to ensure factual accuracy and balanced reporting. By following our Editorial Policy, our writers verify every source, fact-check each story, rely on reputable sources, and attribute quotes and media correctly. We also follow a rigorous Review Methodology when evaluating exchanges and tools. From emerging blockchain projects and coin launches to industry events and technical developments, we cover all facets of the digital asset space with unwavering commitment to timely, relevant information.

Related Articles


- XRP News: XRPL Activates Permissioned DEX Upgrade to Boost Institutional DeFi Adoption
- WLFI Token Sees 19% Spike Ahead of World Liberty’s Mar-a-Lago Forum Today
- Veteran Trader Peter Brandt Predicts Bitcoin Price Rebound, Gold Fall to $4000
- Peter Thiel Exits ETHZilla as Stock Slides 3% Amid Token Launch
- Bitwise, Granitshares Eyes $63B Sector With New Prediction Markets ETF Filing
- Will Sui Price Rally Ahead of Grayscale’s $GSUI ETF Launch Tomorrow?
- Why Pi Network Price Could Skyrocket to $0.20 This Week
- Pi Network Price Beats Bitcoin, Ethereum, XRP as Upgrades and Potential CEX Listing Fuels Demand
- 5 Things Dogecoin Price Needs to Hit $0.20 in Feb 2026
- Bitcoin Price Prediction as Experts Warns of Quantum Risks
- Dogecoin, Shiba Inu, Pepe Coin Price Predictions As BTC Crashes Below $68k


