Will Pepe Coin Price Lose $0.0000006 Mark in October?


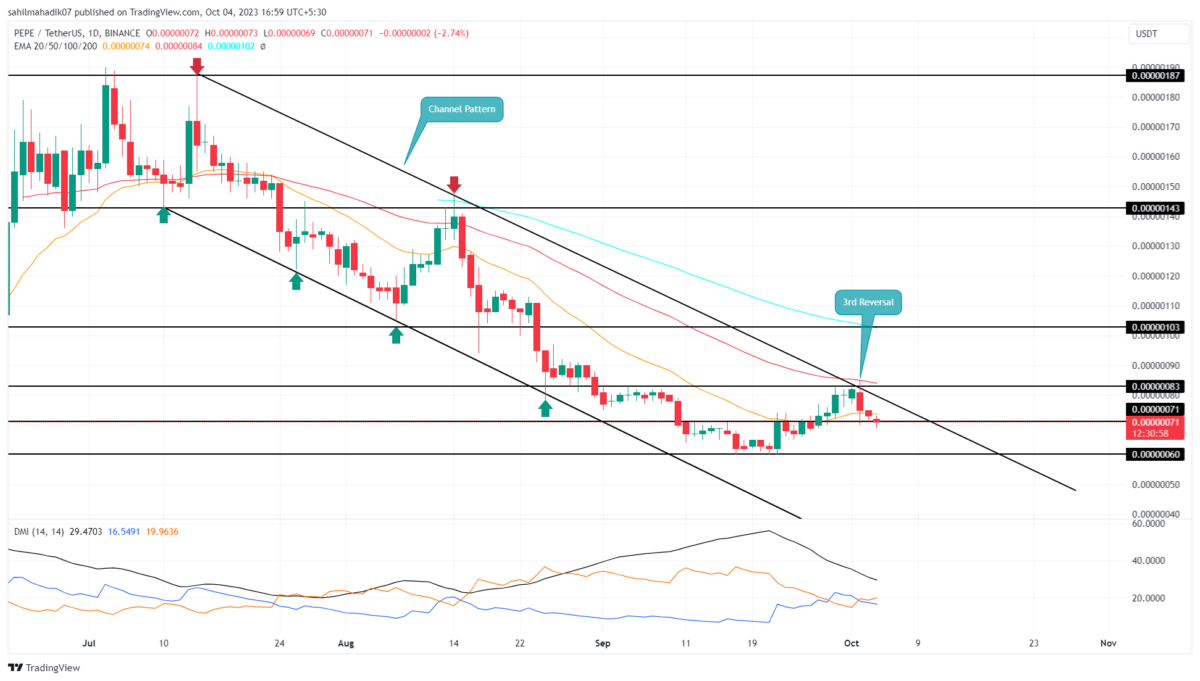
The recovery witnessed in Pepe price towards the September end encountered a significant obstacle from the dual resistance level of $0.00000083 and the upper trendline of an established channel pattern. With the leading cryptocurrency Bitcoin experiencing a pullback from the $28,500 level, the Pepe coin too saw a decline, plummeting by 14% to a local support of $0.0000007. Will this bearish reversal trigger a more profound correction for the memecoin?
Also Read: Is Pepecoin Worth The Hype?
Overhead Supply Hints a downfall to $0.0000006
- A recent reversal from the channel pattern hints at extended correction in the PEPE price
- A breakdown below the 20-day Moving Average would likely accelerate the selling pressure in the market.
- The 24-hour trading volume in the Pepe coin is $51. Million, indicating a 35% loss.
 Source: Tradingview
On October 2nd, the Pepe coin price faced its third rejection from the upper boundary of the channel pattern, which has been dictating its price trajectory for almost three months. The price has consistently interacted with the parallel trendlines of this pattern, underscoring their significant impact on market participant behavior.
Historically, each time the price encountered and retreated from this trendline, it set off a substantial decrease in the daily chart. Given this pattern, the latest retreat poses a similar threat to this memecoin’s valuation.
At the time of writing, the PEPE price is trading at $0.00000072. If it descends below the critical $0.0000007 support, the traders could see a steep 15% decline, potentially testing the psychological support level of $0.0000006. A further descent beneath this level would solidify the bearish narrative, possibly sending the price down to $0.0000005.
Is Pepe Price Ready to Retake $0.000001?
Until the channel pattern is intact, the Pepe coin price will remain in a downward trend. Therefore, traders looking for a bullish opportunity must wait for a breakout above the overhead-resistant trendline. This breakout would signal an early sign of trend reversal and could assist the buyers in regaining $0.000001.
- Exponential Moving Average: The 50-day EMA slope continues to act as a major resistance during bullish rallies
- Directional Movement Index: A bearish crossover between the DI+(Blue) and DI-(orange) slope offers an additional edge to market sellers.

Why Trust CoinGape
CoinGape has covered the cryptocurrency industry since 2017, aiming to provide informative insights Read more…to our readers. Our journal analysts bring years of experience in market analysis and blockchain technology to ensure factual accuracy and balanced reporting. By following our Editorial Policy, our writers verify every source, fact-check each story, rely on reputable sources, and attribute quotes and media correctly. We also follow a rigorous Review Methodology when evaluating exchanges and tools. From emerging blockchain projects and coin launches to industry events and technical developments, we cover all facets of the digital asset space with unwavering commitment to timely, relevant information.
Pepe
24 Hours volume
$566.88M
Market Cap
$1.94B
Max Supply
420.69T

Related Articles


- Expert Predicts Bitcoin Dip to $49K as ‘Trump Insider’ Whale Dumps 5,000 BTC
- Bitcoin Price Rebounds $70K, Here are the Top Reasons Why?
- Crypto Market Weekly Recap: Crypto Bill White House Meeting, Binance Buys $1B BTC, and More (9- Feb 13)
- TRUMP Coin Pumps 5% as Canary Capital Amends ETF Filing With New Details
- Crypto Prices Surge Today: BTC, ETH, XRP, SOL Soar Despite US Government Shutdown
- 3 Top Reasons Pi Network Price Surging Today (14 Feb)
- XRP Price Prediction Ahead of Potential U.S. Government Shutdown Today
- Bitcoin Price Outlook As Gold And Silver Lose $3.6 Trillion in Market Value
- XRP and Ethereum Price Prediction as Trump Seeks to Lower Key Tariffs
- Solana Price Prediction as $2.6 Trillion Citi Expands Tokenized Products to SOL
- Bitcoin Price Could Fall to $50,000, Standard Chartered Says — Is a Crash Coming?


