 Buy $GGs
MATIC Price Prediction: Polygon Is Bearish As $1.750 Looms


MATIC price has dropped approximately 3% over the last 24 hours and is currently trading in a second straight bearish session around $2.033. Polygon (MATIC) daily trading volume has dropped by 28.76% on the day to $ $2,138,406,423. The decreasing trading volume is not a good sign for Polygon bulls as it points to a deeper price correction.
MATIC price Could Drop 14% Towards $1.75
MATIC/USD price is trading at $2.033 at the time of writing and appears to have formed an ascending parallel channel on the daily chart. An ascending parallel chart pattern is as extremely bullish chart pattern that is formed when an asset record a series of higher highs and higher lows suggesting an uptrend.
Therefore, as long as the price of MATIC remains within the confines of the rising channel, it is set to continue rising.
As such, a daily closure above the immediate resistance provided by the $2.14 level could see the Polygon price rise to tag the middle boundary of the prevailing chart pattern around $2.224.
A rise further could see Polygon price rise above the $2.50 psychological level to tag upper boundary of the rising channel at $2.697.
The position of the Moving Convergence Divergence Indicator (MACD) above the zero line and the fact that MATIC still remains within the confines of the rising channel validates Polygon’s bullish outlook.
MATIC/USD Daily Chart
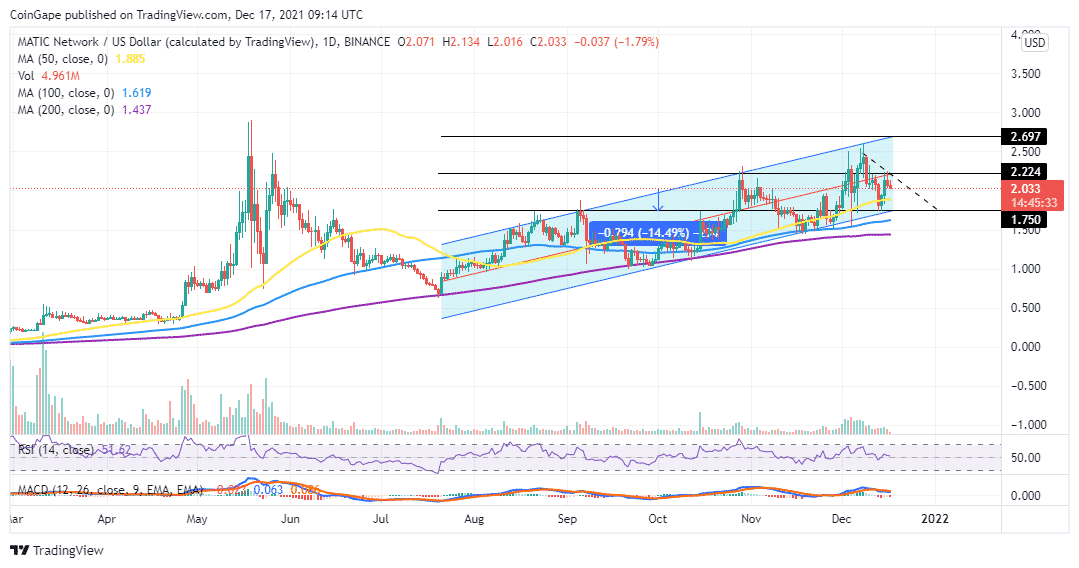
Despite the bullish outlook for Polygon described above, technical on the daily chart point to a continued price correction in the near term. For example, the MATIC has been recording lower highs and lower lows since December 07 as shown by the down trendline.
In addition, the downward movement of the Moving Average Convergence Divergence (MACD) indicator suggests that Polygon’s market sentiment is bearish. Also note that, the MACD recently sent a call to sell MATIC signal on the same daily chart. This happened on December 15 day when the MACD line (12-day Exponential Moving Average-EMA) crossed below the 12-day EMA (orange line) pointing to a bearish MATIC.
Moreover, the decreasing daily trading volume and the downward movement of the Relative Strength Index (RSI) indicator shows that the bears are determined to push the MATIC price lower.
Therefore, if MATIC price fails to hold above the $2.0 psychological level, it will drop to tag the 50 SMA at $1.885. A drop below this point could trigger massive sell orders that could see Polygon drop to tag the lower boundary of the ascending channel at $1.75. If this happens, Polygon price will shed approximately 14.49% from its current price.
Play 10,000+ Casino Games at BC Game with Ease
- Instant Deposits And Withdrawals
- Crypto Casino And Sports Betting
- Exclusive Bonuses And Rewards


Why Trust CoinGape
CoinGape has covered the cryptocurrency industry since 2017, aiming to provide informative insights Read more… to our readers. Our journal analysts bring years of experience in market analysis and blockchain technology to ensure factual accuracy and balanced reporting. By following our Editorial Policy, our writers verify every source, fact-check each story, rely on reputable sources, and attribute quotes and media correctly. We also follow a rigorous Review Methodology when evaluating exchanges and tools. From emerging blockchain projects and coin launches to industry events and technical developments, we cover all facets of the digital asset space with unwavering commitment to timely, relevant information.

Delivered every day.
- Insights that move markets
- 100,000 active subscribers
Related Articles


- “There Is Only One Gold,” Billionaire Ray Dalio Says Amid BTC’s Quantum Threats
- Goldman Sachs CEO Predicts ‘Weeks’ of Crypto Market Crash as U.S Iran War Continues
- Polymarket Axes ‘Nuclear Detonation’ Prediction Market Amid Public Fury
- Indiana Signs Bitcoin Bill Into Law Allowing Crypto in Retirement Plans
- ‘Time to Act Is Now’: CFTC Chief Pushes Swift Passage of CLARITY Act
- Robinhood Stock Price Prediction As Cathie Wood Buys $12M Dip in Bold ARK Move
- Bitcoin Price At Risk? Professor Who Predicted US-Iran War Says America Could Lose
- Gold Price Prediction March 2026: Rally, Crash, or Record Highs?
- RIOT Stock Prediction as Needham, Piper Sandler Slash Target After Earnings
- Cardano Price Outlook As Charles Hoskinson Warns Over CLARITY Act
- Circle Stock Price Climbs 15% to $96, Can Rally Continue in March 2026?


