Polygon Price Analysis: Channel Pattern Fakeout Triggers Buying Opportunity In MATIC Coin


The technical chart indicates the overall trend for Polygon coins is still bullish. Even though the price has recently given a breakdown from the broadening channel pattern, the underlying bullishness in the coin pushed the price above the breakout point, resulting in a bear trap. The new rally shows a V-shaped recovery preparing to knock out higher resistance levels.
Key technical points:
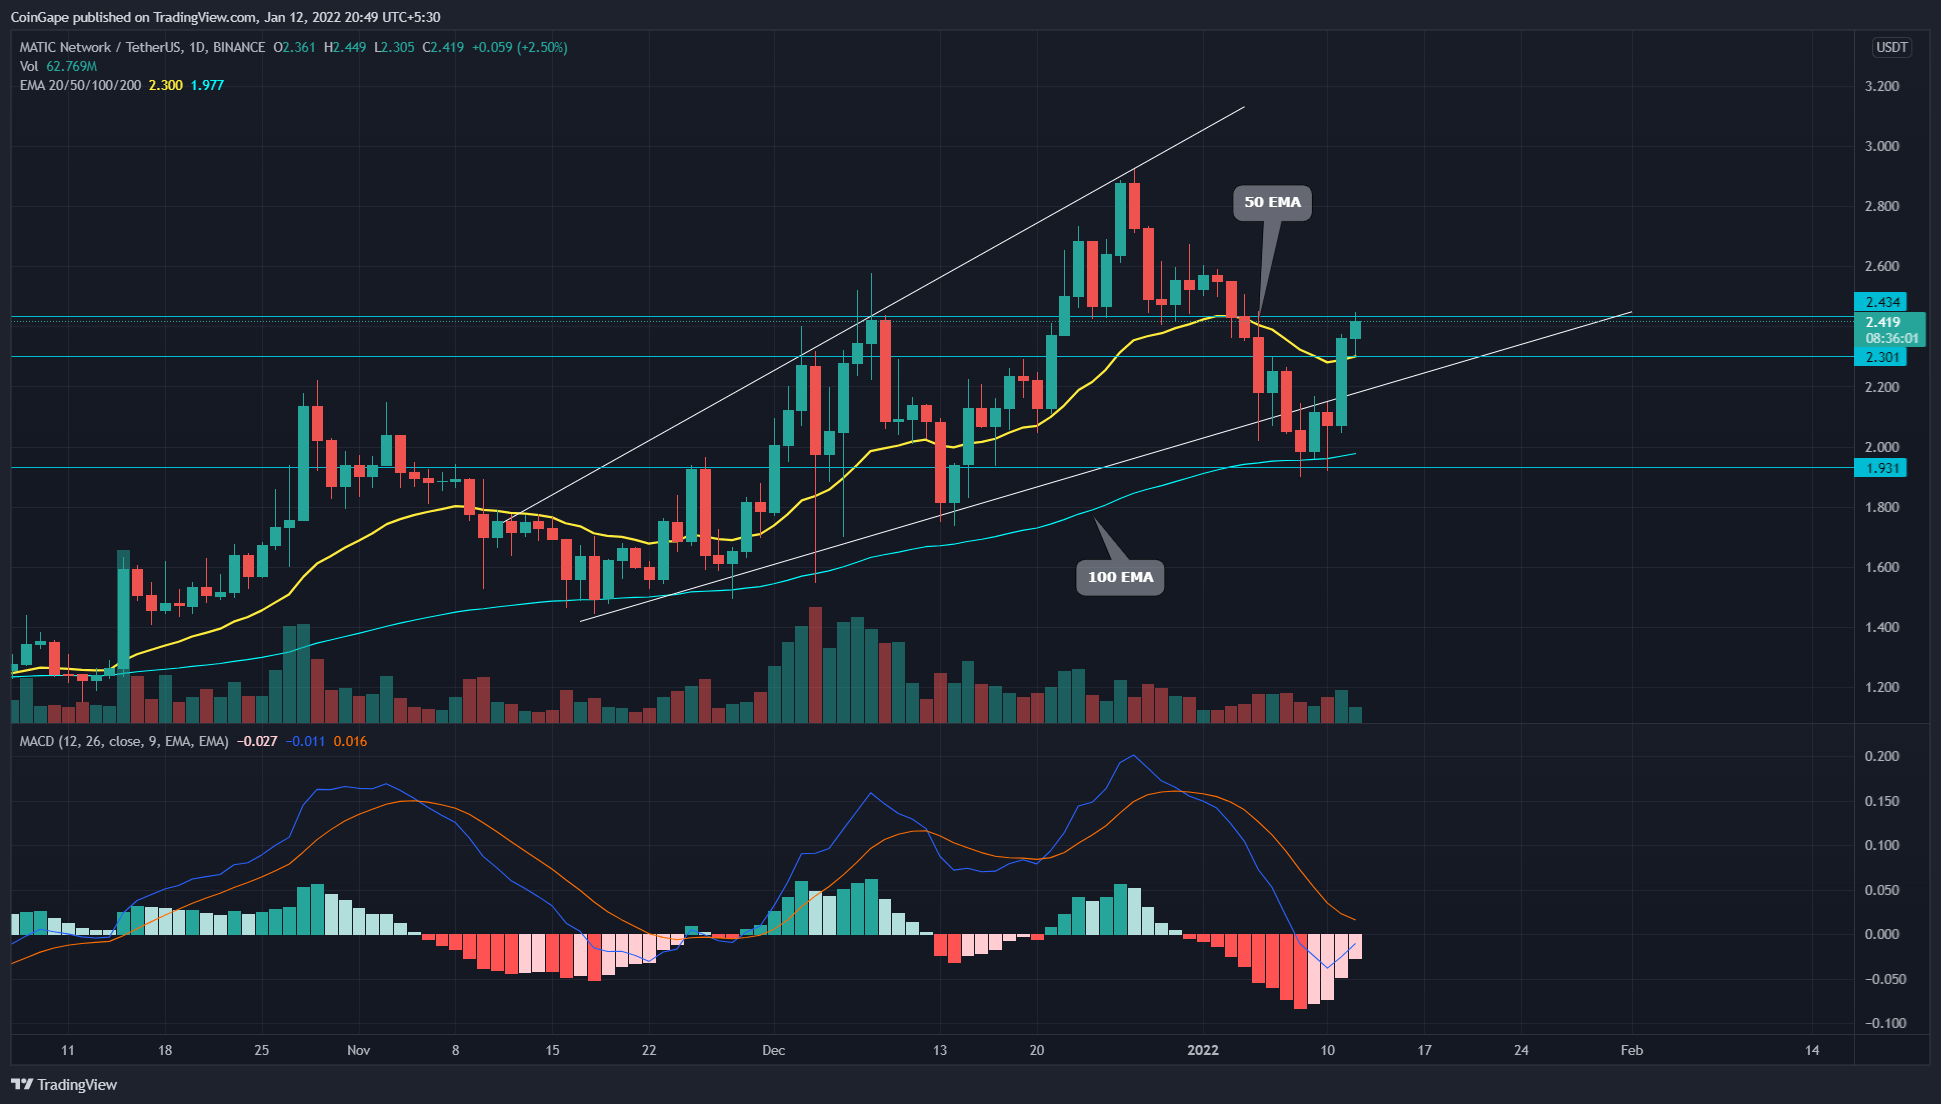
- The MATIC coin price challenges a strong resistance level of $2.43
- The daily-MACD indicator shows its lines are on the verge of a bullish crossover
- The intraday trading volume in the MATIC coin is $1.21 Billion, indicating a 9.275% fall.
 Source- Tradingview
In our previous coverage of Polygon technical analysis, the coin price ascending broadening channel pattern of the daily time frame chart. On January 7th, the price provided a fallout from this pattern, offering an excellent short opportunity for crypto traders.
However, the price could sustain below this level, as confluence support from the 100-day EMA and $1.9 horizontal line brought sufficient demand and pushed the price back above the rising trendline.
The MATIC coin price trading above the crucial EMAs(20, 50, 100, and 200), reclaiming its bullish alignment.
The Moving average convergence divergence shows the MACD and signal are steadily moving towards the neutral zone from above. However, this recent price jump decreases hints at a bullish crossover among these lines.
MATIC Price Challenges Another Higher Resistance Level
 Source-Tradingview
The MATIC price has pumped 26.8% in just three trading days. This V-shaped recovery in price is currently at the doorstep of another resistance of $2.43, preparing for a bullish breakout. However, in case the price rejects from this resistance, the support trendline and $2.4 can still maintain a bullish sentiment.
The falling slope of the average directional movement index(34) indicates the decreasing bearish momentum.
The traditional pivot suggests the important resistance levels for MATIC price is at $2.4, followed by a $2.84 horizontal level in the 4-hour chart. Meanwhile, the support levels are $2.2 and $1.8.

Why Trust CoinGape
CoinGape has covered the cryptocurrency industry since 2017, aiming to provide informative insights Read more… to our readers. Our journal analysts bring years of experience in market analysis and blockchain technology to ensure factual accuracy and balanced reporting. By following our Editorial Policy, our writers verify every source, fact-check each story, rely on reputable sources, and attribute quotes and media correctly. We also follow a rigorous Review Methodology when evaluating exchanges and tools. From emerging blockchain projects and coin launches to industry events and technical developments, we cover all facets of the digital asset space with unwavering commitment to timely, relevant information.

Delivered every day.
- Insights that move markets
- 100,000 active subscribers
Related Articles


- Trump Tariffs: U.S. Lower Tariffs On Taiwan to 15% Ahead Potential Supreme Court Ruling
- Coinbase CEO Says CLARITY Act Progress Has Not Slowed Despite Markup Postponement
- Elon Musk’s X Cracks Down on InfoFi Crypto Projects; KAITO Token Falls 15%
- Bitget’s Tokenized Stock Platform Hits $18B as Traditional Assets Move On-Chain
- XRP News: RLUSD Gets Institutional Adoption Boost as Ripple Invests $150M in LMAX Group
- Shiba Inu Price Prediction: Inverse Head $ Shoulders Tests Critical Zone – Is a Breakout Still in Play?
- Binance Coin Price Prediction As 34th Quarterly BNB Token Burn Takes Place
- Here’s Why Ethereum Price Will Hit $4k By End of Jan 2026
- Solana Price Outlook Ahead of the Alpenglow Upgrade
- Bitcoin and XRP Price Prediction As US Senate Cancels Crypto Market Structure Bill Markup
- Dogecoin Price Poised to Hit $0.18 After Bullish Inverse Head and Shoulders Breakout


