Polygon Price Analysis: Bulls Targets $1.0 Amid Sustained Buying Momentum


Polygon (MATIC ) price started the fresh trading week on a strong note. After testing the intraday high of $0.98, the asset corrected mildly. However, it remained bided near the lower levels.
- MATIC price trades higher on Monday with more than 20% gains.
- A break above 100-day EMA would seek the $1.0 mark on the upside.
- A double top near 0.9800 creates a hurdle for the bulls.
MATIC price started the fresh trading week on a strong note. After testing the intraday high of $0.98, the asset corrected mildly. However, it remained bided near the lower levels.
MATIC sustains gains for the straight third day
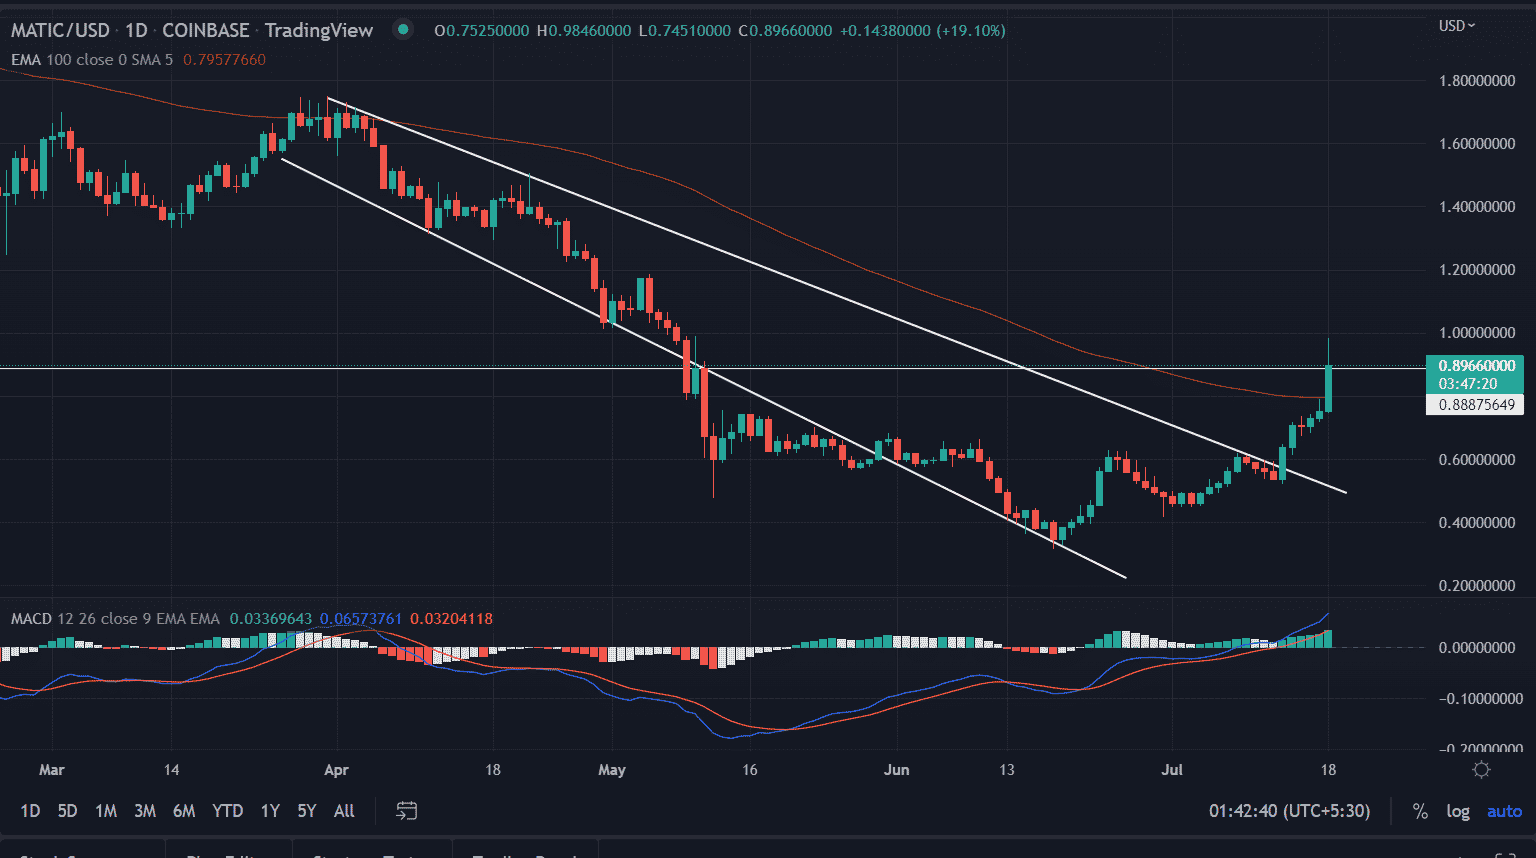
On the daily chart, the MATIC price moved more than 150% from the lows of $0.31 made on June 18. The asset moved in a medium turn downward channel since March. The price gives a breakout on July 13 with gains of. The crossover also coincides with the critical 100-day EMA (Exponential Moving Average) at $0.79. This also fuels the upside rally in the coin.
The Moving Average Convergence Divergence (MACD) trades firmly above the midline with no immediate sign of reversal.
On the other hand, if the MATIC fails to clear the $0.98 resistance zone, it could start a downside correction. In that case, immediate support could be found near the $0.80-$0.79 level.
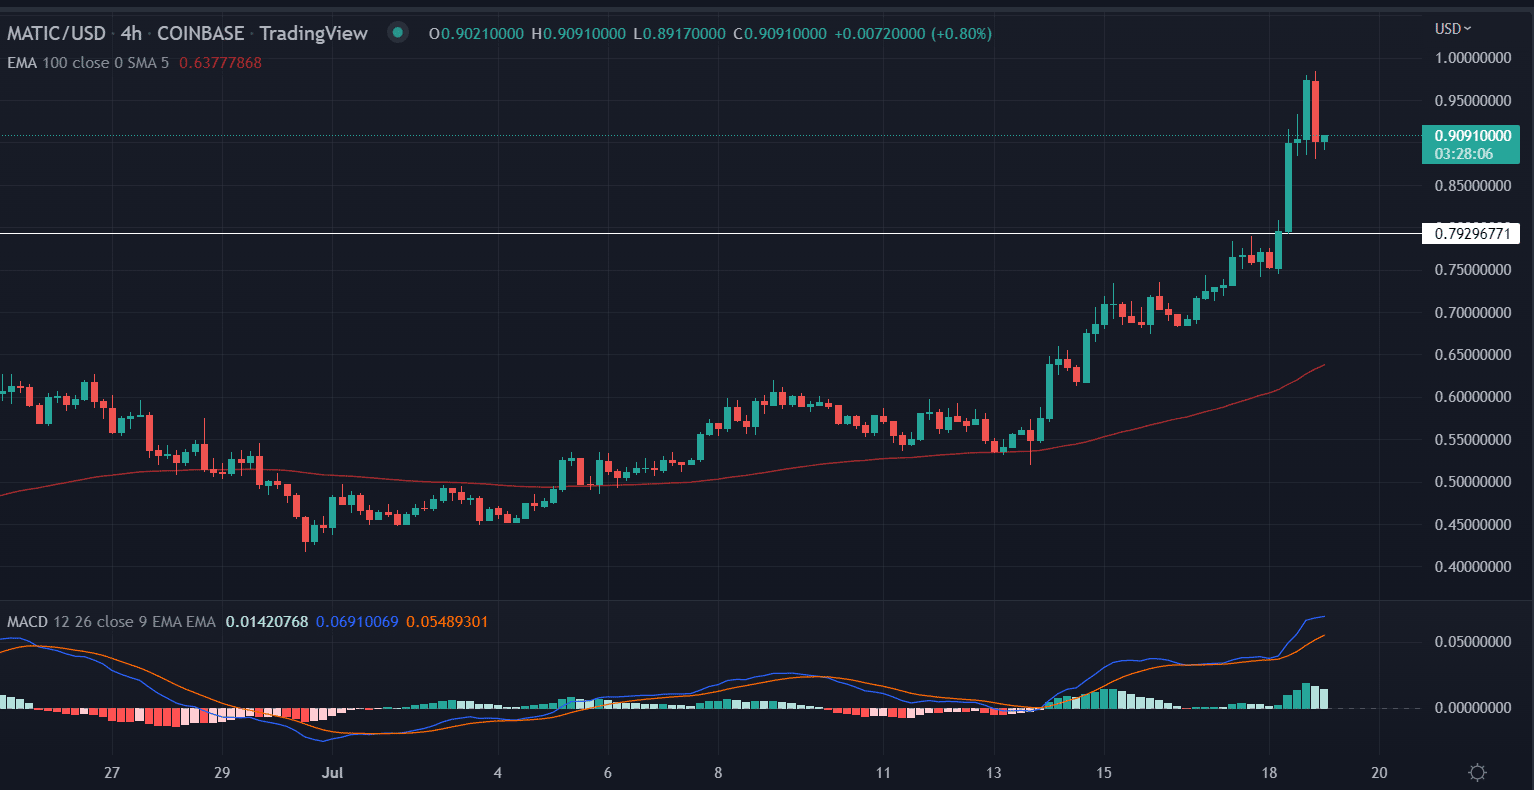
This could be further confirmed on the 4-hour chart. A big red candlestick followed by a fresh lower price level indicates distribution near the supply zone. If MATIC’s price sustains below the horizontal support line of $0.79 then more downside cannot be ruled out. The bears would explore the $0.65-$0.60 support zone next.
By studying multiple time frames, the MATIC price indicates some minor correction as the bulls took a breather near the higher levels. However, a dip-buying opportunity exists for traders.
As of writing, MATIC/USD is exchanging hands at $0.90, up 19.62% for the day.

Why Trust CoinGape
CoinGape has covered the cryptocurrency industry since 2017, aiming to provide informative insights Read more… to our readers. Our journal analysts bring years of experience in market analysis and blockchain technology to ensure factual accuracy and balanced reporting. By following our Editorial Policy, our writers verify every source, fact-check each story, rely on reputable sources, and attribute quotes and media correctly. We also follow a rigorous Review Methodology when evaluating exchanges and tools. From emerging blockchain projects and coin launches to industry events and technical developments, we cover all facets of the digital asset space with unwavering commitment to timely, relevant information.

Delivered every day.
- Insights that move markets
- 100,000 active subscribers