Price Analysis: Ethereum, Polkadot And Filecoin Appreciate Minorly


The cryptocurrency industry has embarked on an impressive recovery. Certain altcoins like Ethereum have catapulted substantially and registered a hike in their respective ROIs by over 50% in just one week. Some altcoins, however, haven’t performed that well comparatively but managed to sustain above their vital support trading levels.
The fear index was also hovering at the neutral mark owing to the most recent recovery encountered by the altcoins.
Ethereum/ETH/USD Four-Hour Chart
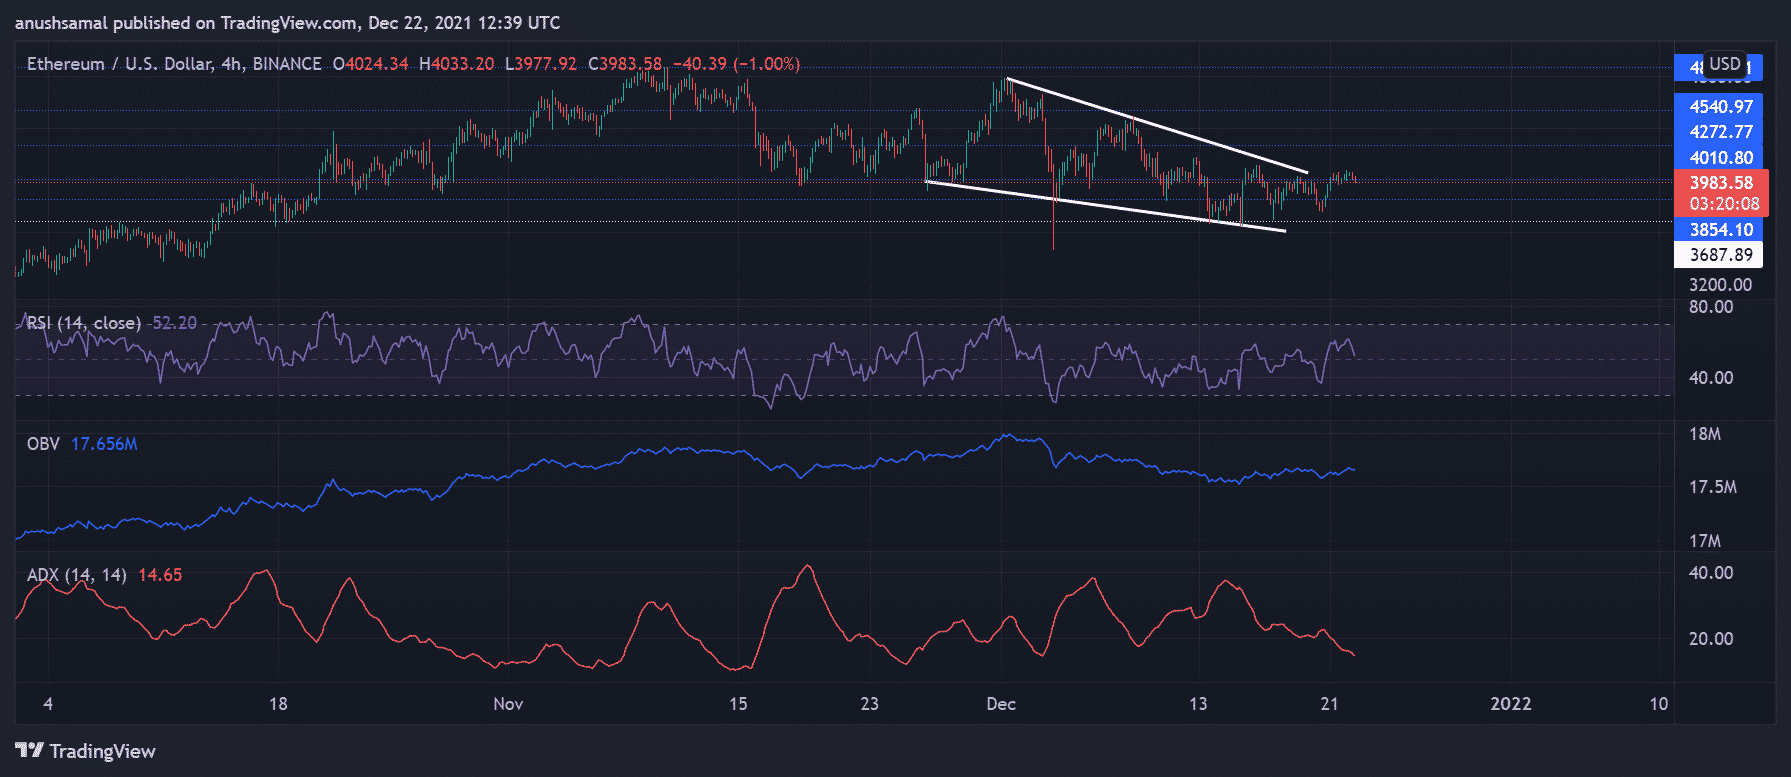
At press time, Ethereum was trading at $3983.58 after securing a gain of 3% over the last 24 hours. The king of altcoin had been trading in a downward motion forming a descending wedge over the past few weeks. As buying strength recuperated, ETH started to trade above its vital support line of $3854.10. Over the last week, Ethereum presented with a 6% return on its investments.
The technicals have currently maintained a bullish stance, but the market trend has portrayed a weak directional trend.
The Relative Strength Index was parked above the half-line, although it noted a slight downtick which signaled sellers re-entering the market. On Balance Volume also reaffirmed the same by showing a small fall on the indicator. The Average Directional Index has indicated a weak directional trend as the indicator was below the 20-mark. This also highlighted that the bulls might fizzle out over the immediate trading sessions.
DOT/USD Four-Hour Chart
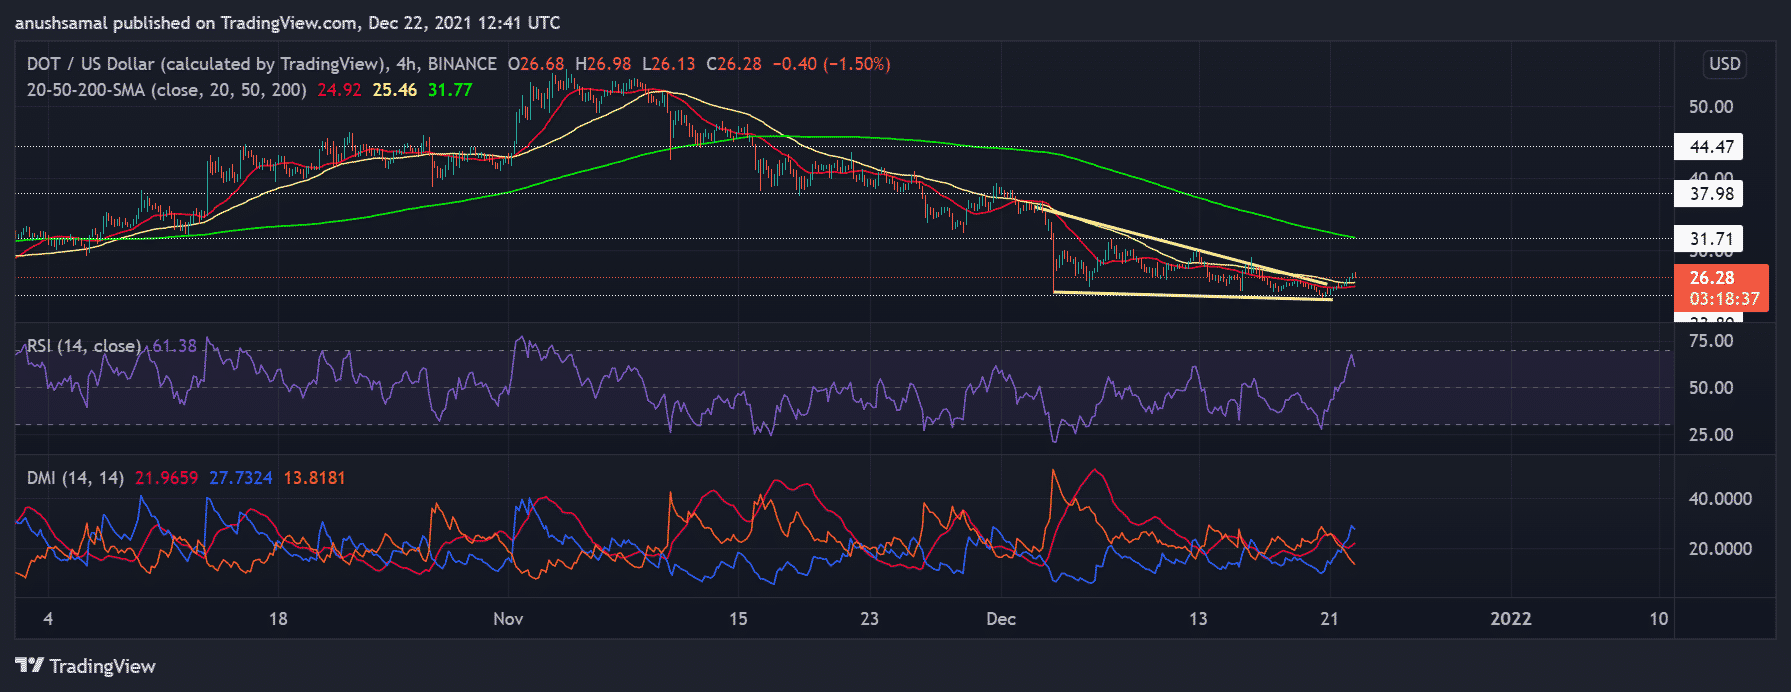
Polkadot was exchanging hands at $26.28 after recording a 6.9% gain in the last 24 hours. Over the last week, the coin brought in a 2.4% ROI. DOT’s bears had formed a descending triangle, and the coin has now broken on the upside. However, the chances of an immediate price reversal cannot be ruled out as the technical indicators have displayed market trend weakness. Immediate price resistance stood at $31.71, and the local price floor was $22.
On the four-hour chart, Polkadot was above the 20-SMA, which highlighted that the buyers had exceeded sellers in the market. The Relative Strength Index was going up north, near the overbought zone, as buying pressure recovered tremendously over the past 24 hours.
The Directional Movement Index was also positive as the +DI line was placed above the -DI line while the Average Directional Index hovered slightly above the 20-mark.
FIL/USD Four-Hour Chart
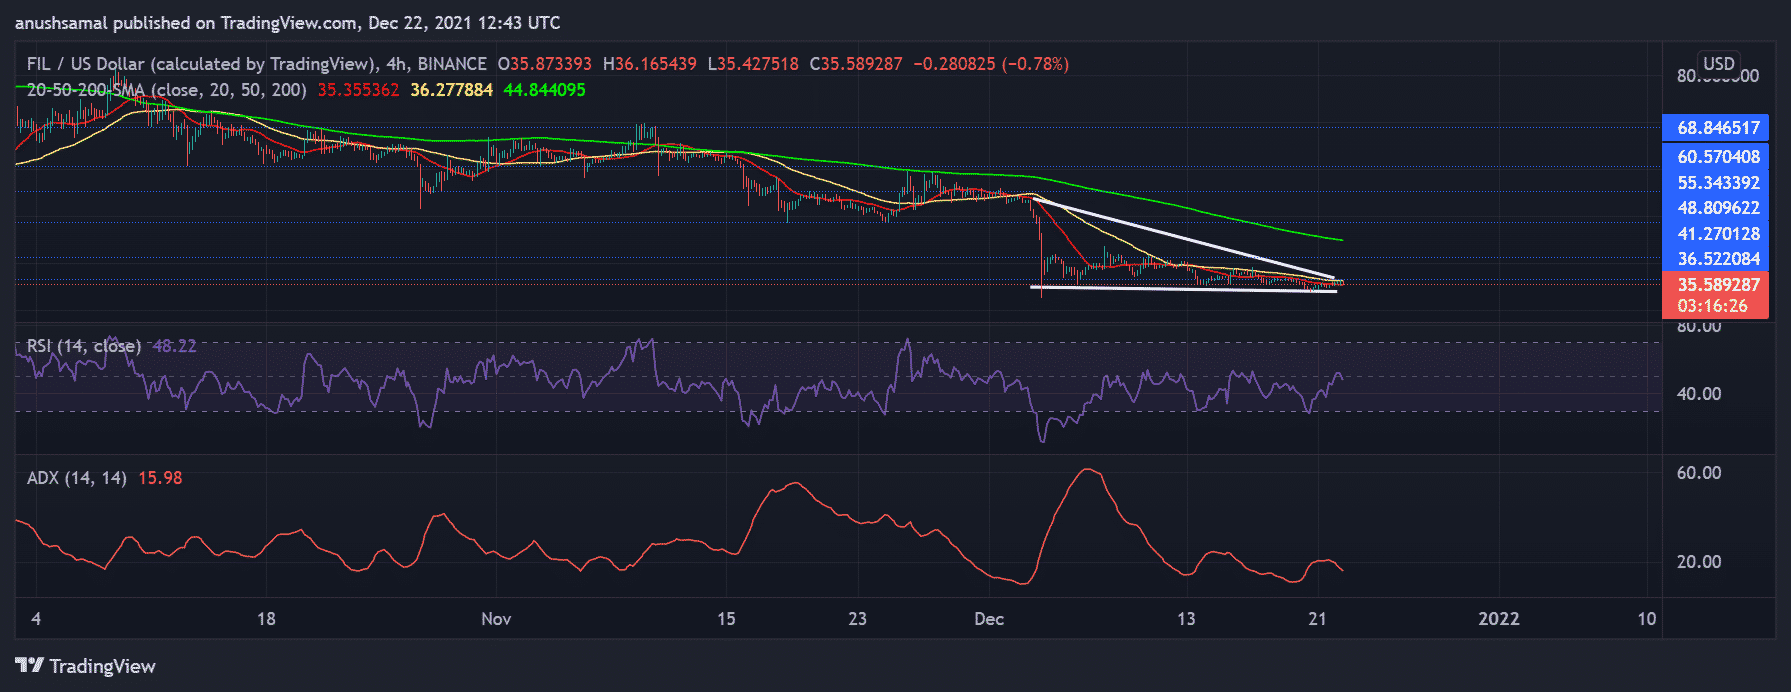
Filecoin had formed a descending triangle in the past week, and at press time, after an appreciation of 1.9% over the last 24 hours, Filecoin was available for $35.58. On the four-hour chart, the price of Filecoin was above the 20-SMA, signifying those buyers have dictated the price momentum in the market. The trading volume of Filecoin had also gone up in the last 24 hours.
After a short period of recovery, the Relative Strength Index noted a downtick which signified that buyers were exiting the market as selling pressure would take over in the upcoming trading sessions.
The Average Directional Index also displayed a weak market trend, indicating a reversal of the current price action. Immediate resistance for the coin stood at $36.52, and the local support region rested at $30.

Why Trust CoinGape
CoinGape has covered the cryptocurrency industry since 2017, aiming to provide informative insights Read more… to our readers. Our journal analysts bring years of experience in market analysis and blockchain technology to ensure factual accuracy and balanced reporting. By following our Editorial Policy, our writers verify every source, fact-check each story, rely on reputable sources, and attribute quotes and media correctly. We also follow a rigorous Review Methodology when evaluating exchanges and tools. From emerging blockchain projects and coin launches to industry events and technical developments, we cover all facets of the digital asset space with unwavering commitment to timely, relevant information.

Delivered every day.
- Insights that move markets
- 100,000 active subscribers
Related Articles


- Crypto Prices Surge Today: BTC, ETH, XRP, SOL Soar Despite US Government Shutdown
- CLARITY Act: Crypto Group Challenges Banks Proposal With Its Own Bill Suggestions
- Trump’s Truth Social Files For Bitcoin, Ethereum, Cronos Crypto ETFs Amid Institutional Outflows
- Trump Tariffs: U.S. Supreme Court Sets February 20 for Potential Tariff Ruling
- Brazil Targets 1M BTC Strategic Reserve to Rival U.S. Bitcoin Stockpile
- XRP Price Prediction Ahead of Potential U.S. Government Shutdown Today
- Bitcoin Price Outlook As Gold And Silver Lose $3.6 Trillion in Market Value
- XRP and Ethereum Price Prediction as Trump Seeks to Lower Key Tariffs
- Solana Price Prediction as $2.6 Trillion Citi Expands Tokenized Products to SOL
- Bitcoin Price Could Fall to $50,000, Standard Chartered Says — Is a Crash Coming?
- Cardano Price Prediction Ahead of Midnight Mainnet Launch


