Price Analysis: MANA, The Sandbox and Algorand Lose Momentum, Decline 7%


Bitcoin’s prices have lurched over the past few days; BTC was consistently moving downhill after touching the $50k mark. As the asset lost over 3% value in the last 24 hours, the industry’s major altcoins have staggered too.
Additionally, the fear index noted ‘extreme fear’ readings highlighting a period of massive sell-off across cryptocurrencies. Decentraland, The Sandbox, and Algorand depreciated considerably and was trading lower than 7% since yesterday.
MANA/USD Four Hour Chart
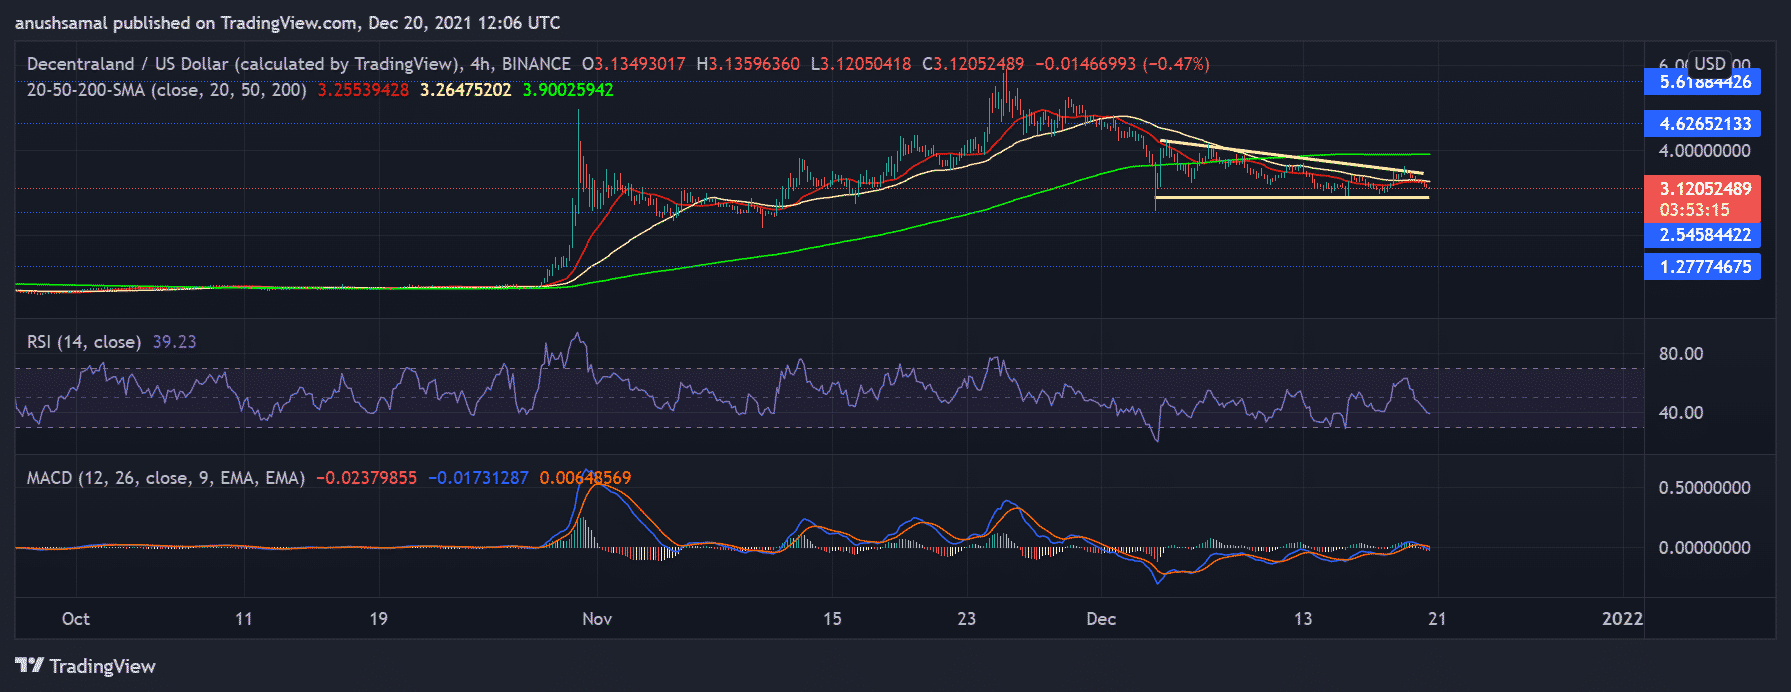
Decentraland had been displaying bearish sentiments since the end of November. MANA was trading on a diligent downward channel. Over a week, it has formed a descending triangle that justified a bearish push in the market.
At press time, the coin was available for $3.12 with an immediate price ceiling of $4.62, and local support rested at $2.54. The coin’s price was seen below the 20-SMA line, indicating that selling pressure took over the market.
The Relative Strength Index struggled to remain afloat over the half-line, but the indicator fell into the negative zone as sellers resurfaced. MACD indicated a strong bearish move after the indicator witnessed a bearish crossover and displayed red histograms at press time.
SAND/USD Four Hour Chart
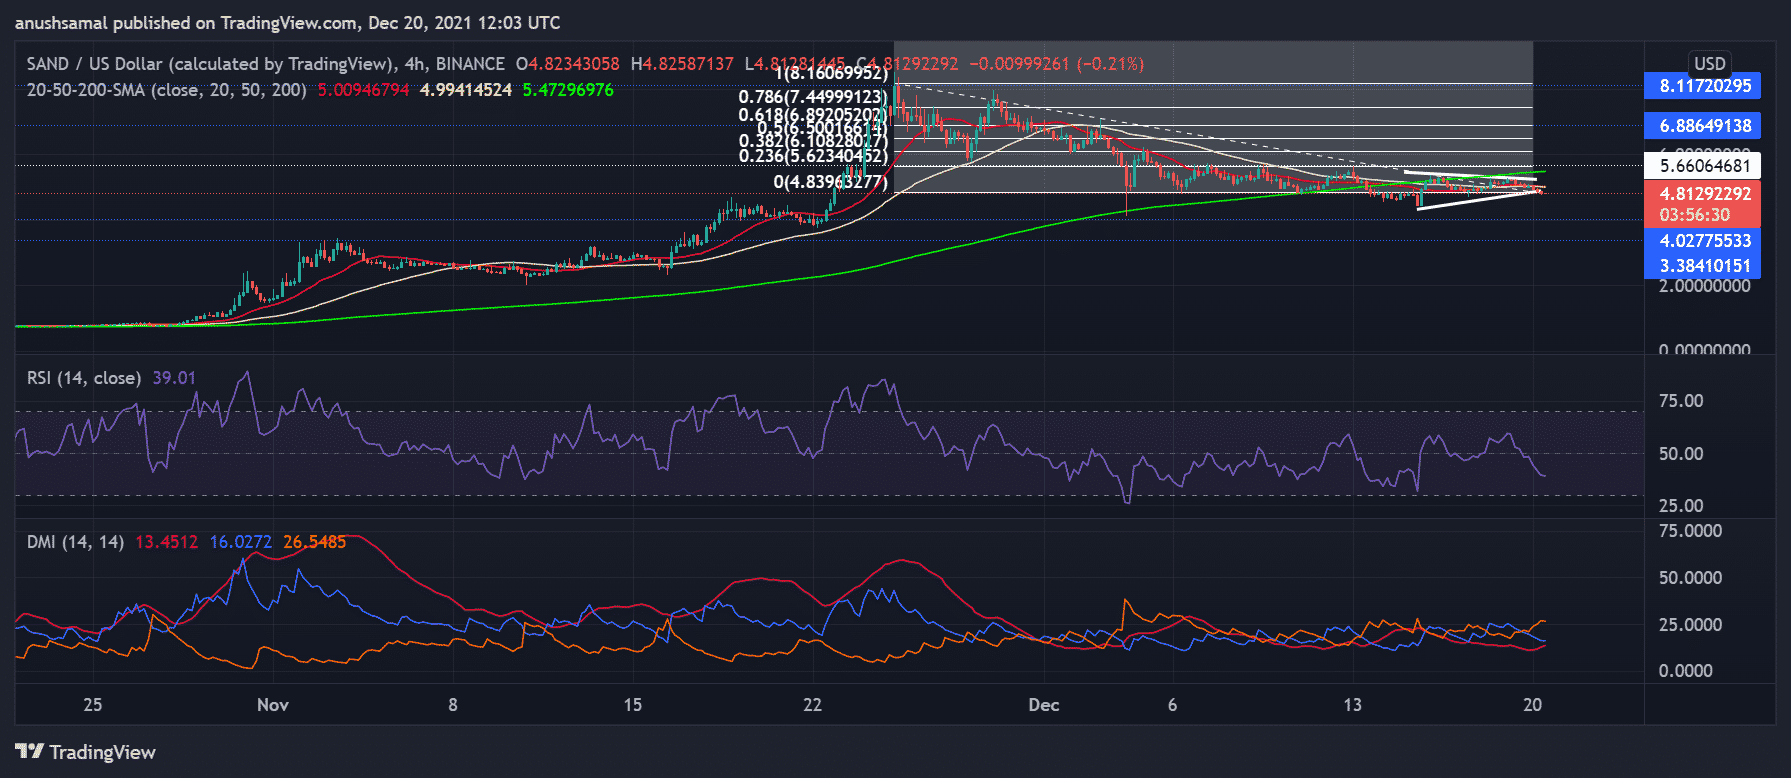
SAND fell by 7.8% over the last 24 hours. Ever since the coin experienced the massive pullback from the 78.6% Fibonacci level, it has been steadily declining. At the time of writing, the coin was priced at $4.81.
SAND’s price fell below the 20-SMA signaling at a continued bearish run. Immediate resistance for the coin was at 23.6% Fibonacci level at $5.66. On the flip side, the price floor region awaited the coin at $4.02.
The Relative Strength Index seemed to weaken as the coin fell below the half-line into the negative zone, selling pressure mounted in the last 24 hours. The Directional Movement Index preferred the bears as the -DI line crossed over the +DI line indicating an undeniable bearish bias at writing.
ALGO/USD Four Hour Chart
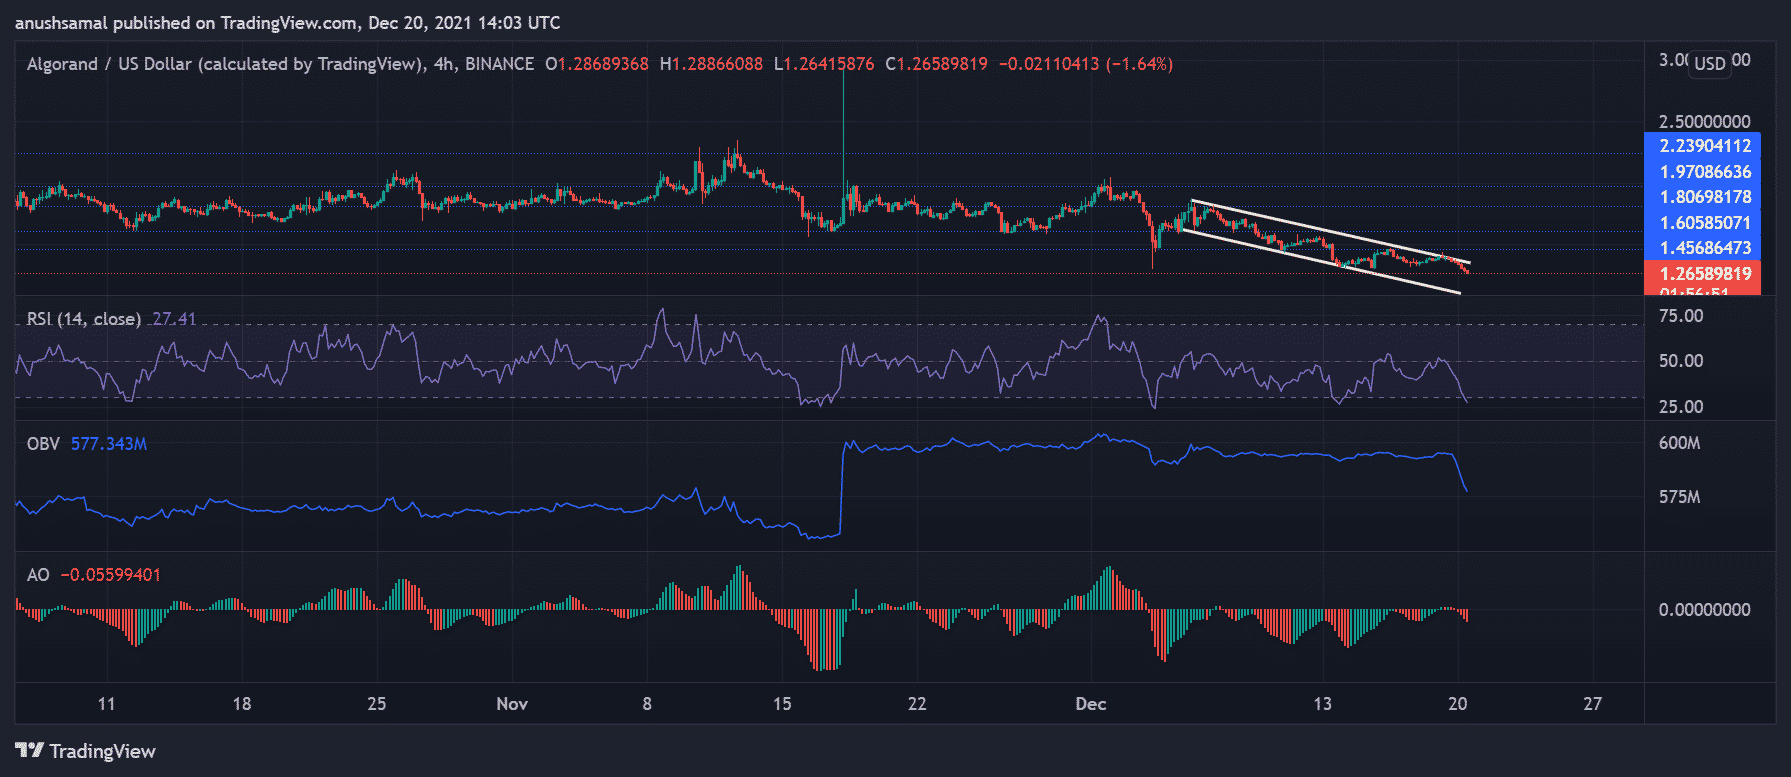
Algorand’s performance has been quite loose as the coin’s price action moved tightly between the descending channel over the past week and a half. Over the last day itself, ALGO brought a loss of 7.2% and was trading at $1.26. A fall from the current level would push ALGO to trade near the $1.19 level, which the coin hasn’t fallen beneath ever since September of this year.
The bulls have snapped the price action, reflecting on the Relative Strength Index as the indicator barely saw the light this month. Sellers have driven the price momentum and continued to do so even at press time.
On Balance, Volume was seen dipping as selling pressure heightened. Awesome Oscillator also flashed bearish readings as the imminent sell-off couldn’t be stalled.

Why Trust CoinGape
CoinGape has covered the cryptocurrency industry since 2017, aiming to provide informative insights Read more… to our readers. Our journal analysts bring years of experience in market analysis and blockchain technology to ensure factual accuracy and balanced reporting. By following our Editorial Policy, our writers verify every source, fact-check each story, rely on reputable sources, and attribute quotes and media correctly. We also follow a rigorous Review Methodology when evaluating exchanges and tools. From emerging blockchain projects and coin launches to industry events and technical developments, we cover all facets of the digital asset space with unwavering commitment to timely, relevant information.

Delivered every day.
- Insights that move markets
- 100,000 active subscribers
Related Articles


- Crypto Prices Surge Today: BTC, ETH, XRP, SOL Soar Despite US Government Shutdown
- CLARITY Act: Crypto Group Challenges Banks Proposal With Its Own Bill Suggestions
- Trump’s Truth Social Files For Bitcoin, Ethereum, Cronos Crypto ETFs Amid Institutional Outflows
- Trump Tariffs: U.S. Supreme Court Sets February 20 for Potential Tariff Ruling
- Brazil Targets 1M BTC Strategic Reserve to Rival U.S. Bitcoin Stockpile
- XRP Price Prediction Ahead of Potential U.S. Government Shutdown Today
- Bitcoin Price Outlook As Gold And Silver Lose $3.6 Trillion in Market Value
- XRP and Ethereum Price Prediction as Trump Seeks to Lower Key Tariffs
- Solana Price Prediction as $2.6 Trillion Citi Expands Tokenized Products to SOL
- Bitcoin Price Could Fall to $50,000, Standard Chartered Says — Is a Crash Coming?
- Cardano Price Prediction Ahead of Midnight Mainnet Launch


