UMA Technical Analysis: UMA Goes Ballistic, Aims For $15
- UMA capitalizes on a bull flag pattern breakout to test resistance at the 200 SMA and $10.
- UMA/USD is doddering between two key levels; the 50 SM and the 200 SMA.
UMA is starting the new week’s trading in style amid a remarkable recovery. Over the last 24 hours, the token accrued more than 20% in gains. It is trading at $9 after running into a barrier at $10.
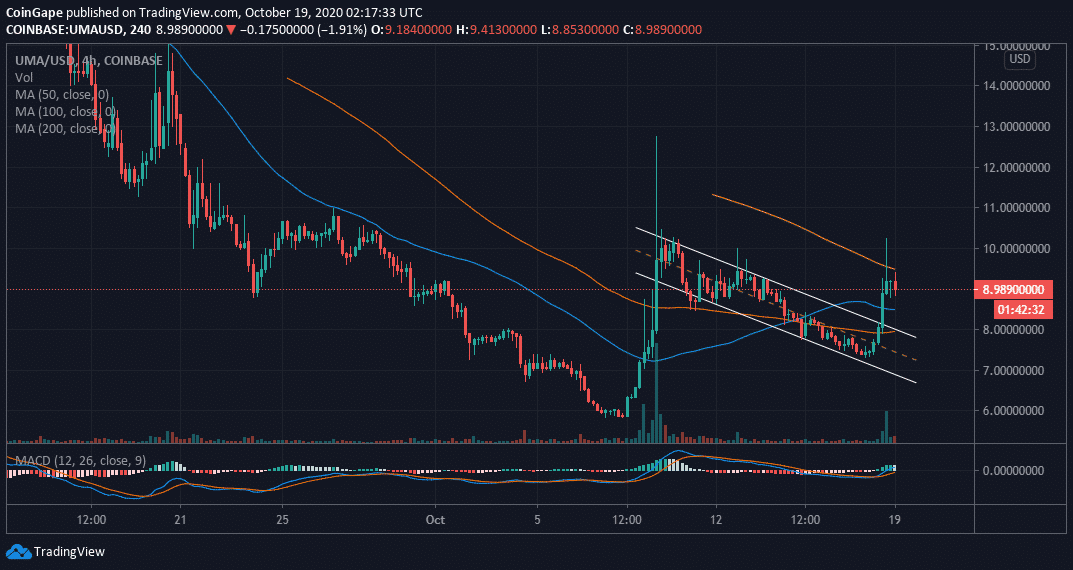
The recovery commenced with a spike above a bull flag pattern as observed on the 4-hour chart. Support at $7 also played a key role by giving buyers balance and stability to shift their focus to higher levels at $10.
UMA extended the impressive price action above several resistances including $10 and the 200 Simple Moving Average. However, little progress was made above these very hurdles. Looking at the Moving Average Convergence Divergence (MACD), the odds seem to be in the favor of the bulls. Besides crossing into the positive territory, a bullish divergence above the MACD highlights the presence of buying pressure.
UMA/USD 4-hour chart
On the upside, price action above the 200 SMA is required to pave the way for the rest of the gains targeting $15. The resistance at $10 might absorb some buying pressure, in turn, delaying recovery.
It is worth mentioning that the bullish outlook could be invalidated if a reversal occurred below the 50 SMA. However, support is envisaged at $8 and $7 respectively. For now, the two key levels took watch are the 200 SMA resistance and the 50 SMA support.
UMA Intraday Levels
Spot rate: $9
Relative change: -0.2
Percentage change: -1.8
Trend: Bullish
Volatility: Low
Recent Posts
- Crypto News
Breaking: Bitwise Files S-1 For SUI ETF With U.S. SEC
Crypto ETF issuer Bitwise is looking to add a SUI ETF to its growing list…
- Crypto News
Crypto Hacks 2025: North Korean Hackers Steal over $2B in ETH and SOL This Year
In 2025, crypto hacks increased significantly. The cybercriminals associated with the North Korean government stole…
- Crypto News
Universal Exchange Bitget Removes Barriers to Traditional Markets, Offers Forex and Gold Trading to Crypto Users
The number one universal exchange Bitget is removing barriers between crypto and traditional finance. It…
- Crypto News
Breaking: U.S. CPI Inflation Falls To 2.7% YoY, Bitcoin Price Climbs
The U.S. CPI inflation came in well below expectations, providing a bullish outlook for Bitcoin…
- Crypto News
Crypto Market Brace for Volatility Ahead of Today’s U.S. CPI Data Release – What to Expect
The crypto market could see some price fluctuations ahead of the release of the major…
- Crypto News
Breaking: Canary Capital Files S-1 for its Staked INJ ETF
Canary Capital amended its staked INJ ETF application with the U.S. Securities and Exchange Commission…