Zcash, NEO and Waves Price Analysis: 09 December


ZEC had taken on a bullish price action right after developers announced their plans of transitioning into the proof-of-stake mechanism. The December 4 crypto crash, however, was a considerable jolt to the broader crypto market and for coins to display movements, support from the broader market remains absolutely necessary. Most altcoins have been witnessing sideways trading, ZEC happens to be one of them.
ZEC/USD Chart In The 4-hour Time Frame
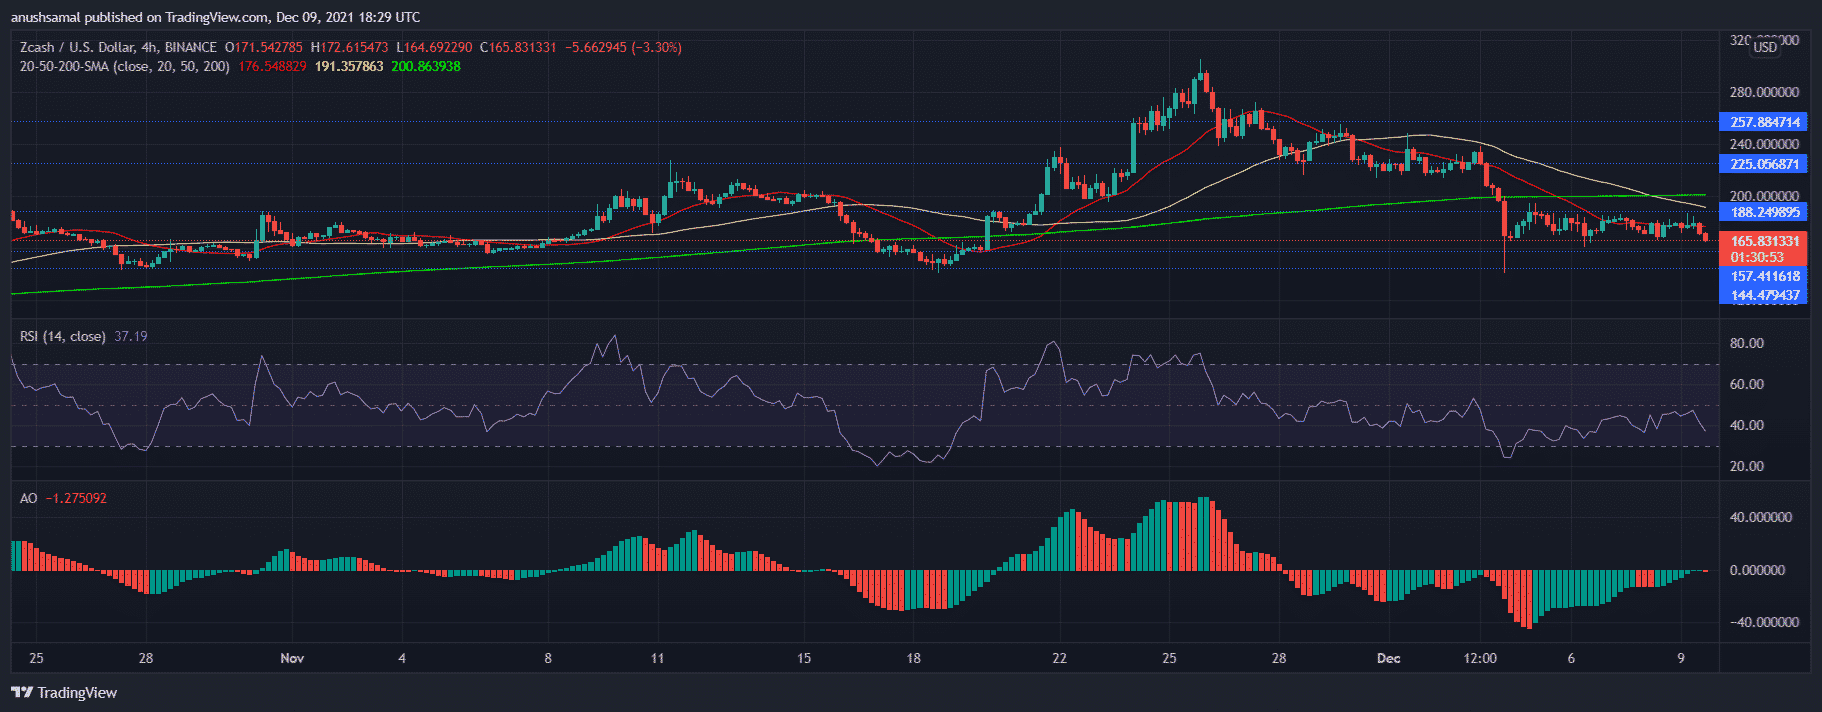
Continued lateral trading along with market weakness has caused ZEC to move downwards. At press time the coin was available for $165.83, it had lost 7.4% over the last 24 hours. Immediate support for the coin was at $157.41, failing to rest over which the altcoin would be priced at $144.47. The technical outlook remained bearish.
The price of the coin was seen below the 20-SMA, a reading that means the market was dominated by sellers. In correspondence, the Relative Strength Index was parked underneath the half-line into bearish territory, which pointed that buyers have exited the market.
Awesome Oscillator flashed a small red histogram in accordance with the bearish price movement of the coin.
NEO/USD Chart In The 4-hour Time Frame
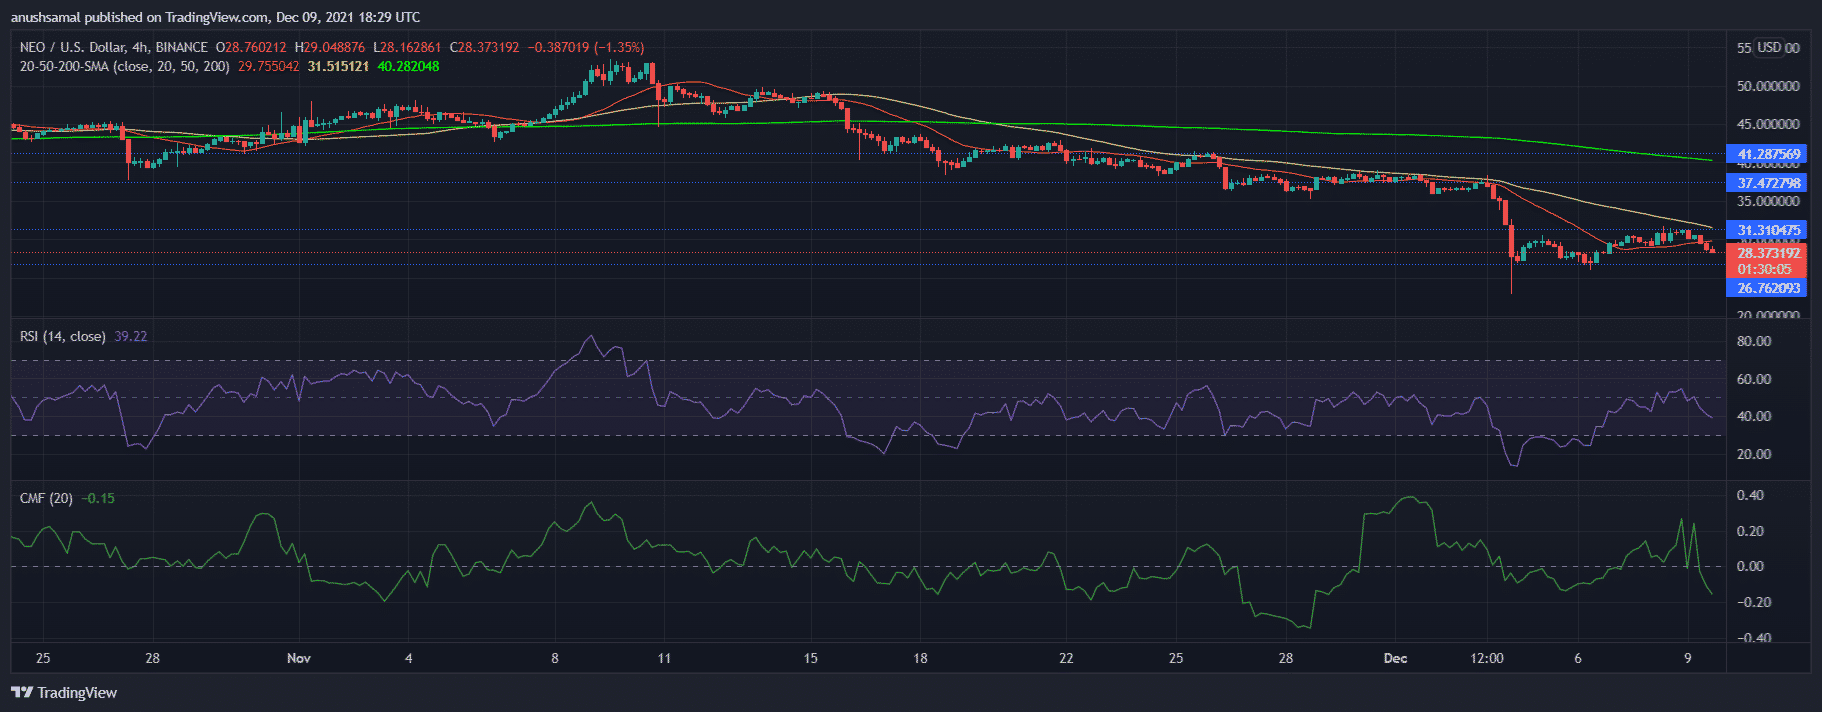
NEO lost 8.7% over the past day and was trading at $28.37. The immediate support level for NEO was at $26.76, continued southbound movement could make the coin trade near that particular price level over the upcoming trading sessions. Technicals on the 4-hour chart seemed bearish.
Buying strength has remained in the negative zone for the last couple of weeks, a weakened buying pressure could further cause prices to dip. On the Relative Strength Index, the buying pressure was parked beneath the half-line.
Chaikin Money Flow also depicted the loss of capital inflows as the indicator was below the zero-line. Price was below the 20-SMA line which also highlighted that sellers dominated the market.
WAVES/USD Chart In The 4-hour Time Frame
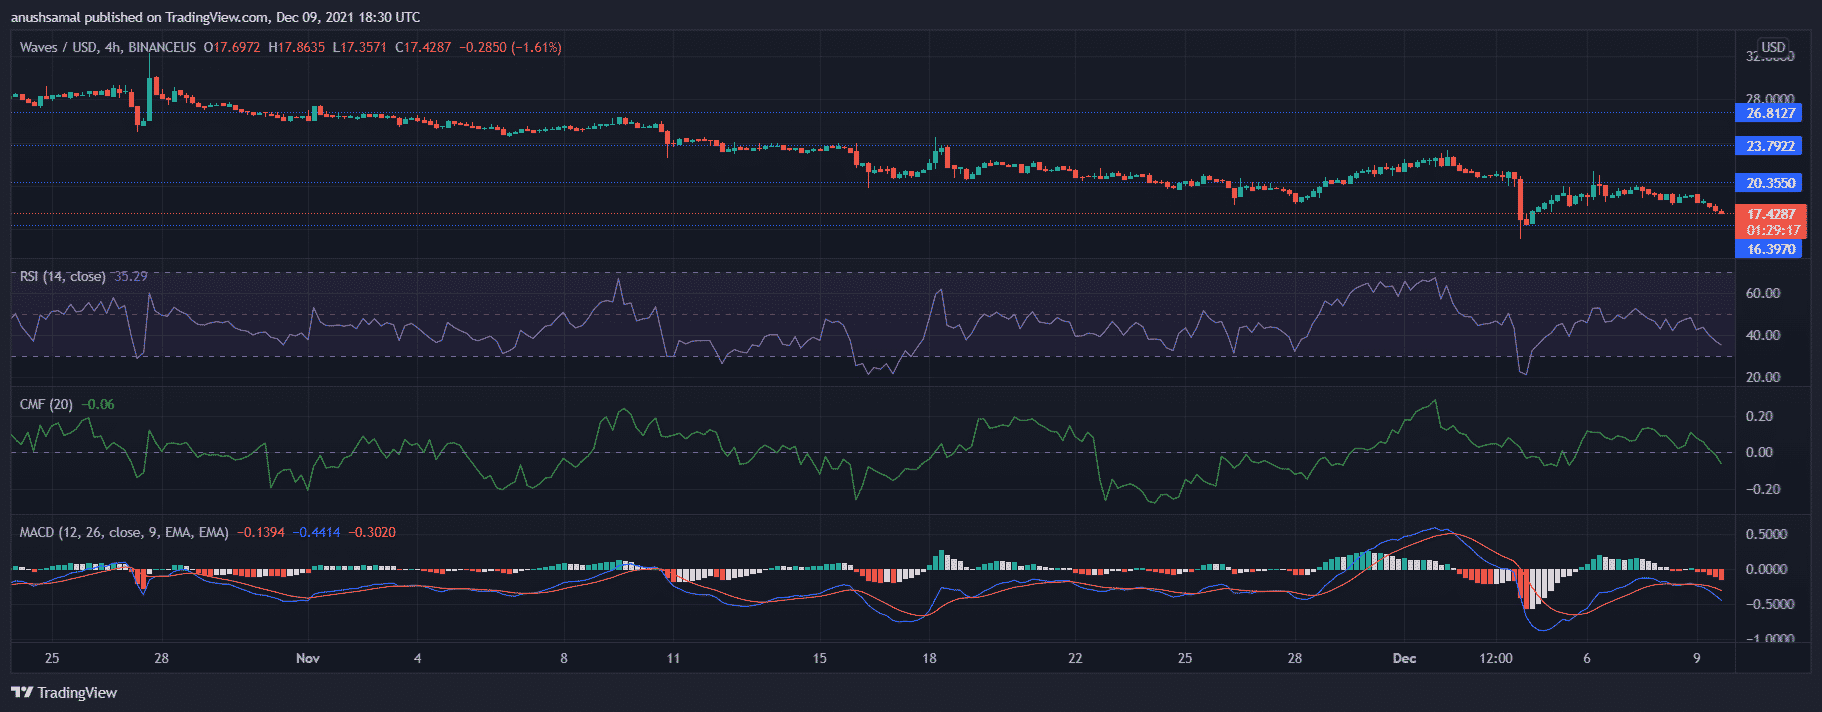
Waves was exchanging hands for $17.42 at the time of writing and it had registered an 8.9% fall over the last 24 hours. The technical outlook for Waves was bearish as the coin hadn’t made a significant bounce back from the crash on December 4. The immediate price resistance for the coin was at $20.35 and the local support level stood at $16.39.
Relative Strength Index was parked underneath the half-line which meant that sellers surpassed the buyers in the market. Capital inflows had also taken a dip as seen on the Chaikin Money Flow. MACD flashed bearish crossover with the presence of red histograms highlighting negative price action.
In the event of Waves breaking over its immediate resistance, it could find itself trading near $23.79.
Why Trust CoinGape
CoinGape has covered the cryptocurrency industry since 2017, aiming to provide informative insights Read more… to our readers. Our journal analysts bring years of experience in market analysis and blockchain technology to ensure factual accuracy and balanced reporting. By following our Editorial Policy, our writers verify every source, fact-check each story, rely on reputable sources, and attribute quotes and media correctly. We also follow a rigorous Review Methodology when evaluating exchanges and tools. From emerging blockchain projects and coin launches to industry events and technical developments, we cover all facets of the digital asset space with unwavering commitment to timely, relevant information.
Delivered every day.
- Insights that move markets
- 100,000 active subscribers
Related Articles


- Strategic Bitcoin Reserve: South Dakota Introduces Bill to Invest in BTC as U.S. States Explore Crypto
- Trump Speech in Iowa Today: Possible Impact on Stocks and Crypto Market
- XRP Payments Utility Expands as Ripple Launches Treasury Platform
- Trump’s Crypto Adviser Confirms Probe Into Alleged Theft From U.S. Crypto Reserve
- Federal Reserve to Hold Interest Rates Until June, Crypto Traders Predict
- Shiba Inu Price Outlook As SHIB Burn Rate Explodes 2800% in 24 Hours
- Pi Network Price Prediction as 134M Token Unlock in Jan 2026 Could Mark a New All-Time Low
- Bitcoin Price Outlook as US Dollar Index Hits 4-Year Low, Gold Soars
- Stock Market Today: Nasdaq, Dow, S&P 500 Futures Rise Ahead of Fed Meeting, and Jobless Claims
- Bitcoin And XRP Price Prediction Ahead of FOMC Meeting Tomorrow, Jan 28
- XRP Price Prediction as Ripple Scores Big Partnership in Cash-Rich Saudi Arabia


