Harmony Price Analysis: Hit Three Month High Near $0.30; Hold or Exit?


Harmony (ONE) price analysis indicates a bullish outlook for the day. The price opened lower but recovered quickly to test the session high of $0.029. This is a strong resistance zone as extends it from June. Additional buying pressure could push the price toward the new swing highs.
However, a retracement in the short time frame suggests a healthy correction is impending, which can be utilized by the sidelined investors. The bears could hit the support of $0.026.
As of press time, ONE/USD is exchanging hands at $0.028, up 4.46% for the day. The market cap has jumped over $400 million with a more than a 3% decline. However, the 24-hour trading volume lost 47% to $431,815,510.
- Harmony edges higher following a previous day’s lackluster move.
- The price is taking support near the critical 50-day EMA at $0.026.
- A bearish RSI on a short-time frame suggests a minor correction of $0.24.
The Harmony price after hitting an intraday high
Harmony price looks for an upside extension
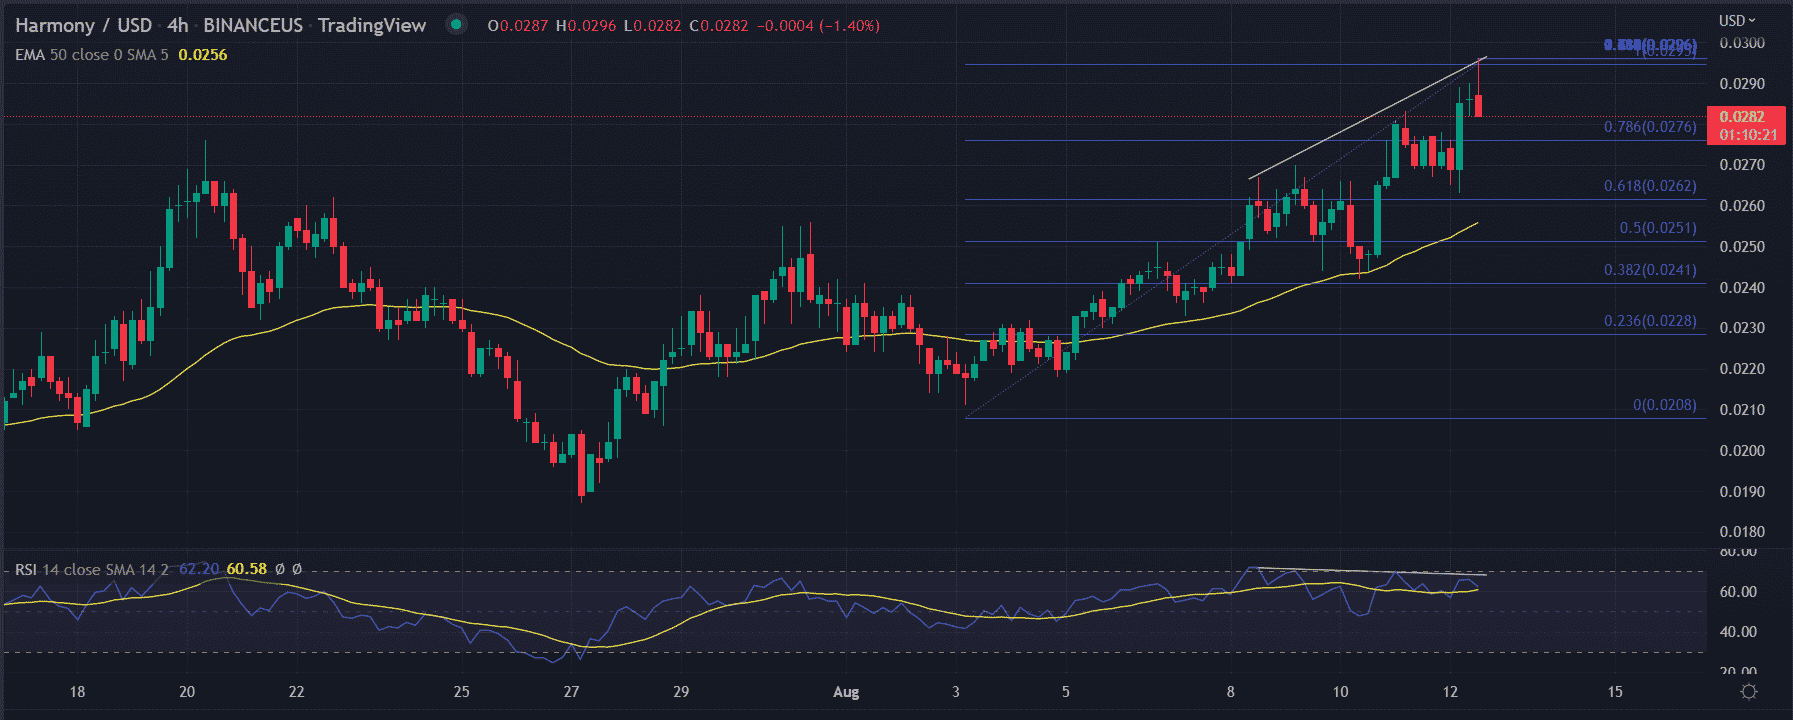
On the four-chart, the Harmony price analysis indicates a retracement from the higher level as the bulls tested the three-month-old resistance zone. The bulls seem to be exhausted and looking for additional participants to carry forward the gains.
The price made a recovery which attracted the bears with further selling momentum diluting the price continuously. An immediate call to bulls is required to sustain the gains.
The price is expected to take support near the 0.618% Fibonacci retracement level at $0.026. The Fibonacci retracement extends from the lows of $0.021 offering support at the critical level. Further, the Harmony price is making higher highs and higher lows. Following the previous trend, the price is due for a correction. But the overall trend remains positive.
A renewed buying pressure might avoid the mentioned price correction and could bounce back from the session’s low of $0.027. If that occurs, the first upside target would be high on June 12 at $0.331 followed by the psychological $0.040 mark.
On the other hand, a continued upside pressure might trigger the selling toward $0.26. This would make bears hopeful and would aim for $0.023.
Also read: https://coingape.com/ethereum-hard-fork-is-inevitable-ethereumpow-retaliates-etc-cooperative/
A bearish RSI points at the impending bearish outlook. It currently reads at 60. A downtick in the indicator would strengthen the downside momentum.
1-hour chart warns aggressive bids
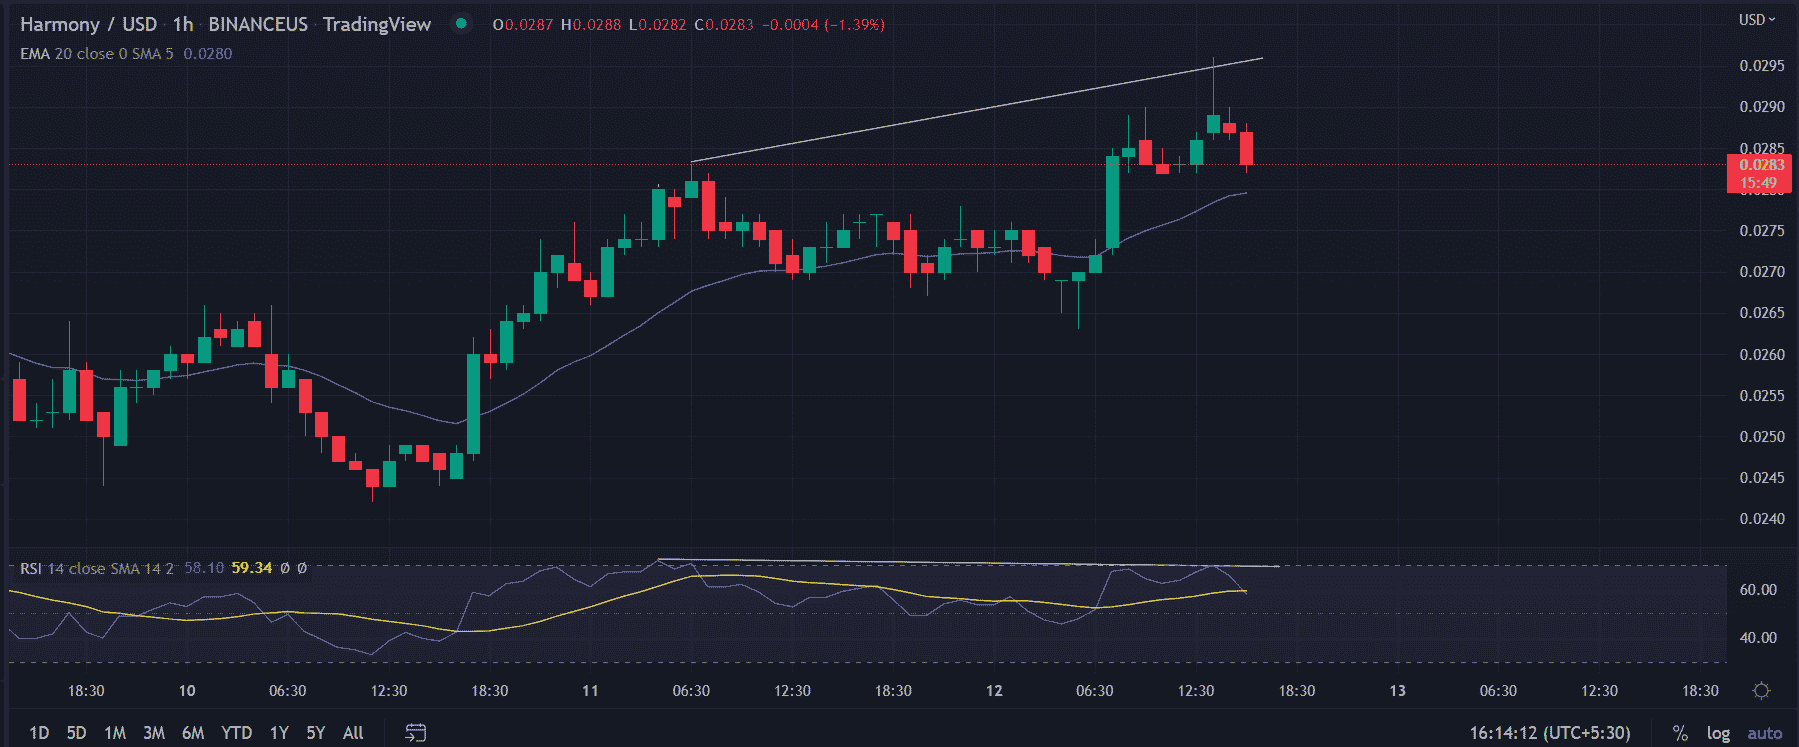
The RSI indicator on the hourly time frame indicates the average line is being tested by the buyer line and is currently attempting to breach it. If successful would result in a pullback toward $0.25.
To conclude, the overall trend is looking mildly bullish. A daily close above $0.29 would further open the gates for more gains.

Why Trust CoinGape
CoinGape has covered the cryptocurrency industry since 2017, aiming to provide informative insights Read more…to our readers. Our journal analysts bring years of experience in market analysis and blockchain technology to ensure factual accuracy and balanced reporting. By following our Editorial Policy, our writers verify every source, fact-check each story, rely on reputable sources, and attribute quotes and media correctly. We also follow a rigorous Review Methodology when evaluating exchanges and tools. From emerging blockchain projects and coin launches to industry events and technical developments, we cover all facets of the digital asset space with unwavering commitment to timely, relevant information.

Related Articles


- Breaking: U.S. Supreme Court Strikes Down Trump Tariffs, BTC Price Rises
- Breaking: U.S. PCE Inflation Rises To 2.9% YoY, Bitcoin Falls
- BlackRock Signals $270M Bitcoin, Ethereum Sell-Off as $2.4B in Crypto Options Expire
- XRP News: Dubai Tokenized Properties Trading Goes Live on XRPL as Ctrl Alt Advances Project
- Aave Crosses $1B in RWAs as Capital Rotates From DeFi to Tokenized Assets
- Ethereum Price Rises After SCOTUS Ruling: Here’s Why a Drop to $1,500 is Possible
- Will Pi Network Price See a Surge After the Mainnet Launch Anniversary?
- Bitcoin and XRP Price Prediction As White House Sets March 1st Deadline to Advance Clarity Act
- Top 3 Price Predictions Feb 2026 for Solana, Bitcoin, Pi Network as Odds of Trump Attacking Iran Rise
- Cardano Price Prediction Feb 2026 as Coinbase Accepts ADA as Loan Collateral
- Ripple Prediction: Will Arizona XRP Reserve Boost Price?


