Algorand Price Discounted 16% Amid Recent Sell-off; Buy This Dip Now?


The Algorand price shows a sideways rally over the past three months. During this consolidation, the altcoin rebounded from this support multiple times, validating it as a strong accumulation zone. Furthermore, a recovery rally initiated from this support has witnessed a significant correction and plunged to $0.33 support. Thus, the coin chart displaying a recovery sign at this support should provide a good dip opportunity for traders.
Key points from Algorand price analysis:
- The ALGO holders can see a brighter future if the prices sustain above the 50-day EMA in the coming weeks.
- The long-wick daily candle projects high chances of a bullish reversal.
- The 24-hour trading volume in the Algorang coin is $195 Million, indicating a 5.87% gain.
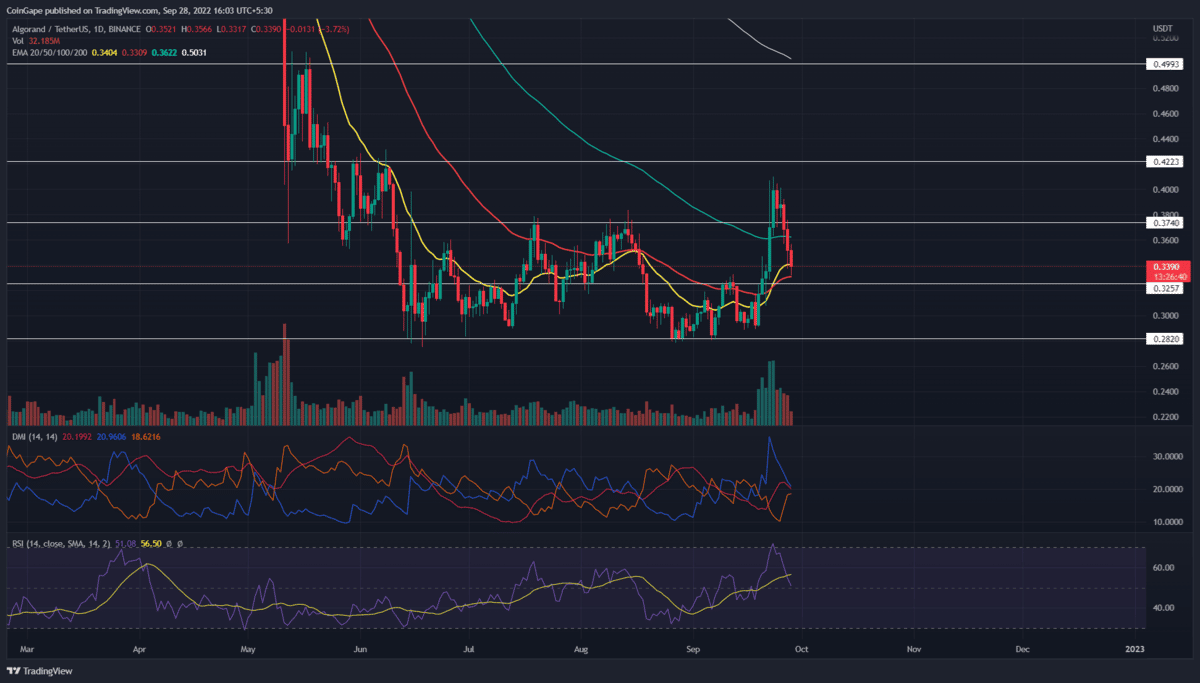
 Source-Tradingview
The Algorand price action showcased a bullish reversal rally failing to sustain above the 100-day EMA due to the increased selling pressure at the $0.40 mark. The bullish failure leads to a price drop of 13% back under the 100-day EMA and the previous consolidation range.
The increase in the intraday trading volume supporting the bearish correction rally endangers the bullish dominance at the 50-day EMA.
However, the lower price rejection in the daily candle implies the correction as the retest to local support of $.33. Hence the price action analysis hints at a post-correction reversal.
The sideline buyers can find entry opportunities at the current prices due to this long-wick candle, taking support at the 50-day EMA, and the declining trend in the trading volume. The reversal rally can reach $0.37, where it will face double opposition from the 100-day EMA and the $0.37 resistance level, which can prove to be a solid roadblock.
Nonetheless, a more encouraging trend can give a bullish breakout entry, prolonging the uptrend to the $0.42 mark.
However, if reversal fails, the Algorand price could eventually lose the 50-day EMA and plummet price to $0.281.
Technical indicators:
DMI- The sharp fall in the Algorand price sabotages the bullish gap in the DI lines leading to a higher possibility of a bearish crossover.
RSI- The daily-RSI slope reverted from the overbought region and witnessed a significant downfall. This retracement indicates the prior aggressive buying has stabilized, and prices can continue their upward march.
- Resistance levels: $0.37 and $0.42
- Support levels: $0.33 and $0.28
Instant Currency Exchange at BestChange with Ease
- Compare Rates Across 1000+ Exchanges
- Access 250+ Cryptocurrencies & Pairs
- Save Time with Real-Time Price Tracking


Why Trust CoinGape
CoinGape has covered the cryptocurrency industry since 2017, aiming to provide informative insights Read more…to our readers. Our journal analysts bring years of experience in market analysis and blockchain technology to ensure factual accuracy and balanced reporting. By following our Editorial Policy, our writers verify every source, fact-check each story, rely on reputable sources, and attribute quotes and media correctly. We also follow a rigorous Review Methodology when evaluating exchanges and tools. From emerging blockchain projects and coin launches to industry events and technical developments, we cover all facets of the digital asset space with unwavering commitment to timely, relevant information.