 Buy $GGs
Terra Classic Price Analysis: What’s Next for $LUNC Price; $0.0001 or $0.00007?


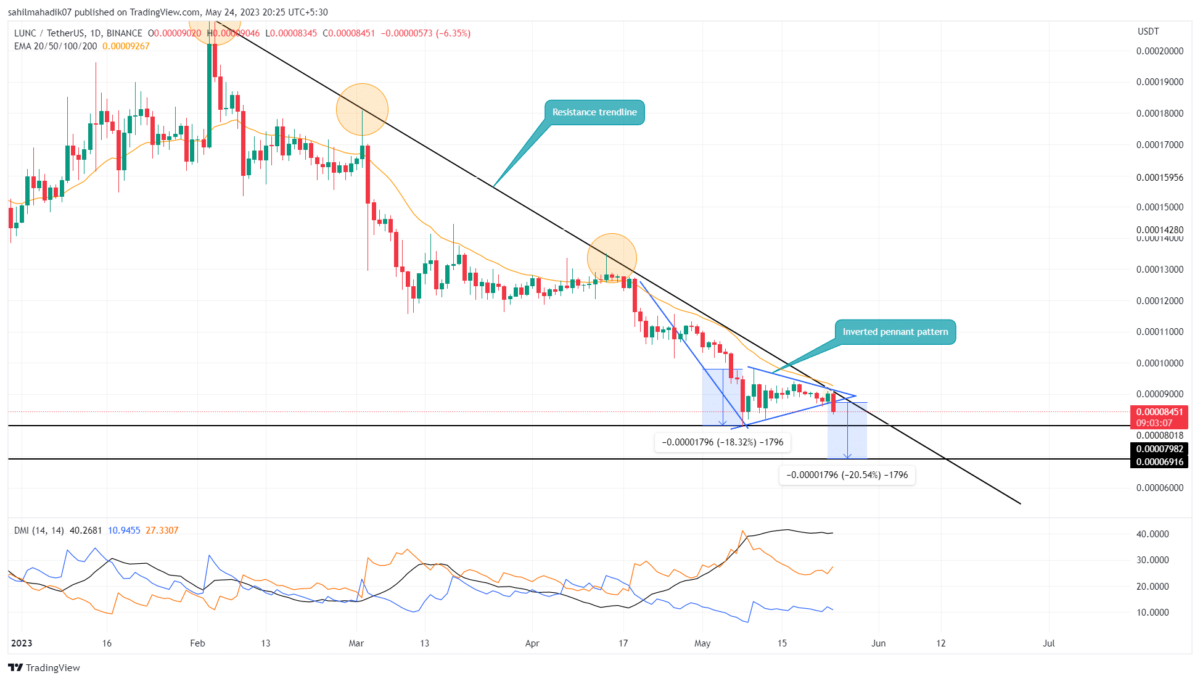
Terra Classic Price Analysis: Amid the highly volatile market phase, the LUNC price remained in a sideways trend over the past two weeks. However, the daily chart shows this consolidation was restricted within two converging trendlines indicating the formation of an inverted pennant pattern. This chart pattern is one of the famous bearish continuation patterns which bolsters prolonged downfall after its completion.
Also Read: Binance CEO Supports Terra Classic Raising LUNC Burn Tax To 0.5%
LUNC Price Daily Chart
- A breakdown below the bearish pennant pattern support intensifies the selling momentum in LUNC
- A downsloping trendline governs the current downtrend in this altcoin
- The intraday trading volume in the LUNC coin is $22.2 Million, indicating a 13% loss.
 Source- Tradingview
On May 24th, the LUNC price witnessed a significant outflow and registered a loss of 6.38%. The long bearish candle printed showed a massive breakdown from the support trendline of the pennant pattern indicating the seller’s reclaiming trend control. A 1.55% fall today offers a suitable follow-up to this breakdown and a short-entry opportunity for traders
Moreover, the support trendline flipped into a potential resistance would provide sellers an additional resistance to pressurize buyers. In theory, the first target of sellers for pennant breakdown is the same distance between the high and low of the earliest part of the pattern shot from the breakpoint.
Thus, the LUNC price is likely to tumble 20% and hit the psychological support of $0.00007.
The bearish thesis will get invalidated upon the breakout of the long-coming resistance trendline.
Will LUNC Price Break Below $0.00008 support?
The completion of the bearish pennant pattern has set the LUNC price for potential downfall. If the coin price shows sustainability below the breached trendline, the coin price is more likely to $0.00008 support and plunge to even lower chart levels.
- Exponential Moving Average: The downsloping 20-day EMA acts as a dynamic resistance offering additional resistance in the seller’s favor to draw the LUNC price lower.
- DMI: The distance between the DI-(orange) and DI+(blue) widening in a bearish alignment reflects the bearish trend is active.
Play 10,000+ Casino Games at BC Game with Ease
- Instant Deposits And Withdrawals
- Crypto Casino And Sports Betting
- Exclusive Bonuses And Rewards


Why Trust CoinGape
CoinGape has covered the cryptocurrency industry since 2017, aiming to provide informative insights Read more…to our readers. Our journal analysts bring years of experience in market analysis and blockchain technology to ensure factual accuracy and balanced reporting. By following our Editorial Policy, our writers verify every source, fact-check each story, rely on reputable sources, and attribute quotes and media correctly. We also follow a rigorous Review Methodology when evaluating exchanges and tools. From emerging blockchain projects and coin launches to industry events and technical developments, we cover all facets of the digital asset space with unwavering commitment to timely, relevant information.

Related Articles


- Crypto Market Update: Top 3 Reasons Why BTC, ETH, XRP and ADA is Up
- Crypto News: Bitcoin Sell-Off Fears Rise as War Threatens Iran’s BTC Mining Operations
- U.S.–Iran War: Monday Crypto Crash Odds Rise As Pundits Predict Oil Price Spike
- US-Iran War: Reports Confirm Bombings In UAE, Bahrain and Kuwait As Crypto Market Makes Recovery
- XRP Price Dips on US-Iran Conflict, But Capitulation Signals March Rebound
- Bitcoin And XRP Price As US Kills Iran Supreme Leader- Is A Crypto Crash Ahead?
- Gold Price Prediction 2026: Analysts Expect Gold to Reach $6,300 This Year
- Circle (CRCL) Stock Price Prediction as Today is the CLARITY Act Deadline
- Analysts Predict Where XRP Price Could Close This Week – March 2026
- Top Analyst Predicts Pi Network Price Bottom, Flags Key Catalysts
- Will Ethereum Price Hold $1,900 Level After Five Weeks of $563M ETF Selling?


