


Market Volatility Threatens $LUNC Price For Prolong Downfall: Will $0.00008 Hold or Fold?


Over the past week, the price of LUNC has remained strictly within the range levels of $0.0000826 and $0.0000102. During this consolidation phase, the daily chart has shown long price rejections at both of these levels, indicating uncertainty among market participants. However, despite the volatility, the coin price has not violated the levels of the falling wedge pattern, suggesting that the Terra Classic coin price is primed for significant growth.
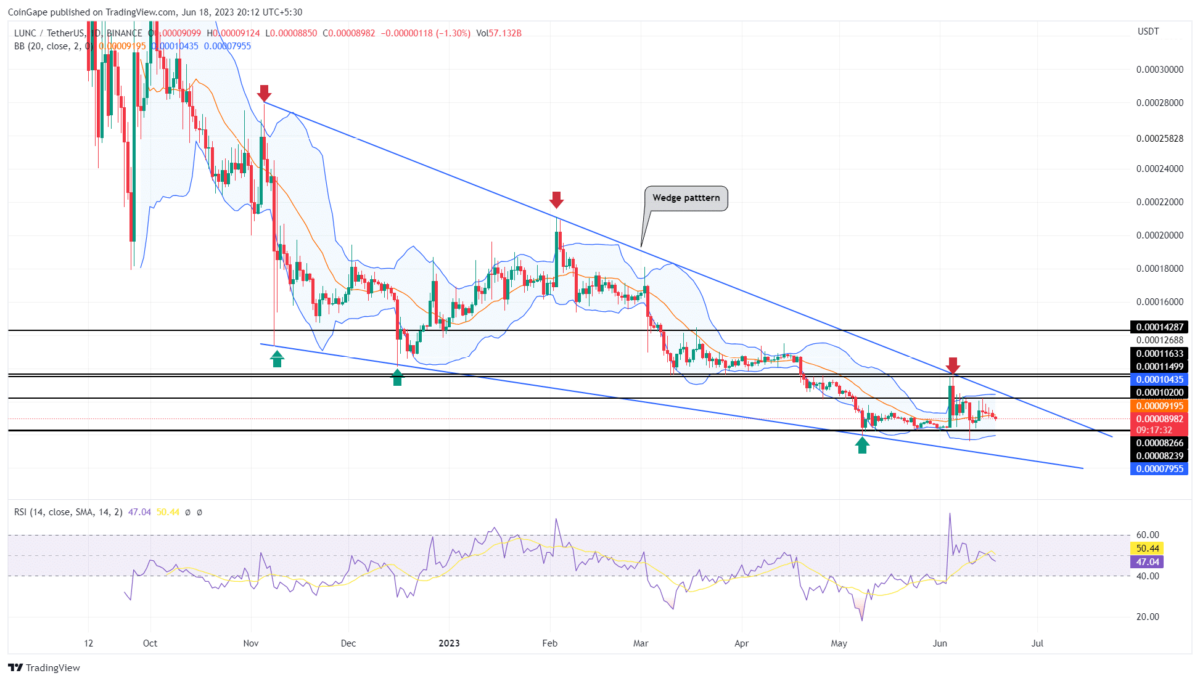
LUNC Price Daily Chart:
- The range between $0.000102 and $0.0000826 represents a no-trading zone.
- Coin traders may face demand pressure at the $0.0000826 level.
- The intraday trading volume of the LUNC coin is $36.5 million, indicating a 24% gain.
 (Source: Tradingview)
Following the broader market sentiment, the LUNC price experienced a downturn from the local resistance of $0.000102. This decline led to a 13% drop in the coin price within a week, bringing it to the current price of $0.0000889.
If the bearish momentum persists, there is a likelihood of the coin price plunging another 7% to reach the strong monthly support level of $0.0000826. This retest will serve as a gauge of buyers’ conviction to sustain higher prices and could potentially act as a launching pad for a trend reversal.
As long as the range levels of $0.000102 and $0.0000826 remain intact, the Terra Classic coin price is expected to continue moving sideways and undergo a volatile phase.
Under pessimistic conditions, a breakdown of the aforementioned support levels will intensify selling pressure in the market, potentially pushing the price toward the $0.000062 mark.
Will the LUNC Price Kick-Start a New Recovery Cycle?
Currently, a falling wedge pattern is influencing the ongoing correction phase in the LUNC price. The resistance trendline of this pattern has repeatedly thwarted buyers’ attempts over the past seven months. Therefore, a key requirement for buyers to regain control of the trend is a bullish breakout above the aforementioned trendline, which could potentially trigger a rally above the $0.0001 mark.
- Relative Strength Index (RSI): Despite the lower low in price action, the daily RSI is showing a noticeable rally, indicating…
- Bollinger Bands: The relatively flat upper and lower bands of the Bollinger Band indicator can serve as significant resistance/support levels, potentially prolonging the sideways trend.
Instant Currency Exchange at BestChange with Ease
- Compare Rates Across 1000+ Exchanges
- Access 250+ Cryptocurrencies & Pairs
- Save Time with Real-Time Price Tracking

Why Trust CoinGape
CoinGape has covered the cryptocurrency industry since 2017, aiming to provide informative insights Read more…to our readers. Our journal analysts bring years of experience in market analysis and blockchain technology to ensure factual accuracy and balanced reporting. By following our Editorial Policy, our writers verify every source, fact-check each story, rely on reputable sources, and attribute quotes and media correctly. We also follow a rigorous Review Methodology when evaluating exchanges and tools. From emerging blockchain projects and coin launches to industry events and technical developments, we cover all facets of the digital asset space with unwavering commitment to timely, relevant information.


