 Buy $GGs
LUNC Price to Hit $0.00009 High? Key Indicator Signals Reversal Sign at Support


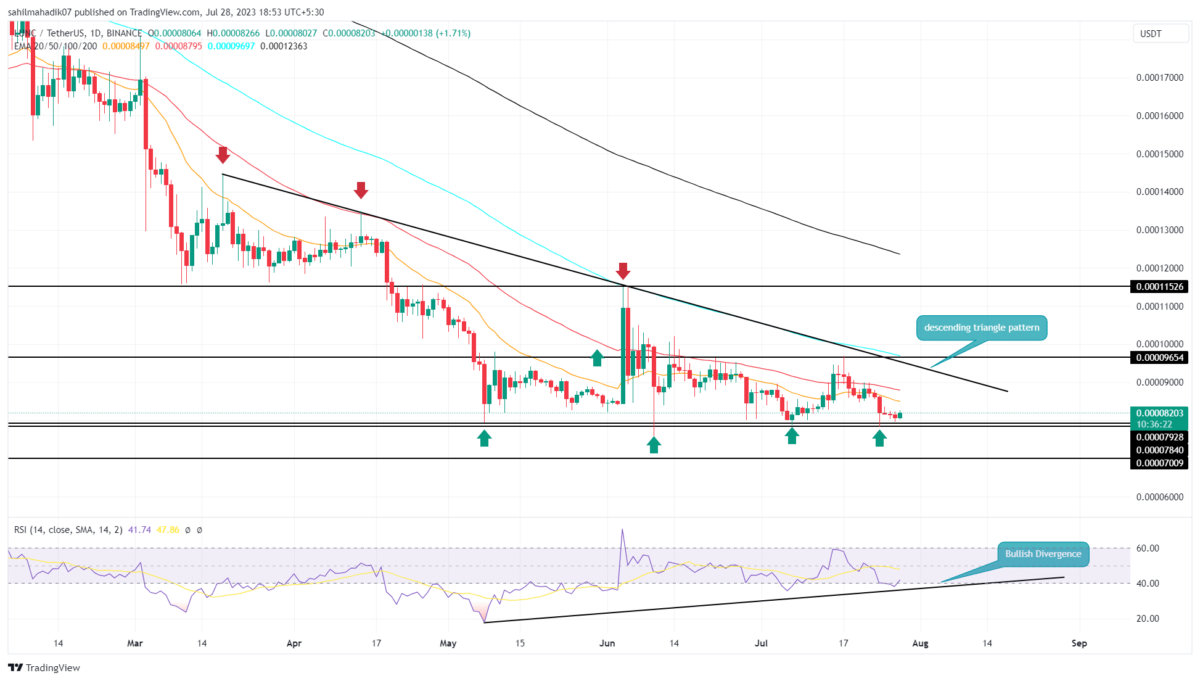
Over the past four months, a downsloping trendline has been constantly hammering the LUNC price with dynamic resistance. The daily chart shows three rejections from this trendline indicating the traders are actively selling at this level. Though the growing supply pressure tries to maintain an established downtrend, the buyers heavily protect horizontal support of $0.000079. The falling trendline and flat support resemble the formation of a bearish continuation pattern called a descending triangle. Here’s how this pattern could influence the future price of Terra classic coins.
Also Read: Terra Luna Classic L1TF Announces Partnership For Station And Finder Development
LUNC Price Daily Chart
- A potential reversal from $0.000079 sets the LUNC price for a 10% jump.
- The market participants witnessed demand pressure at the $0.000079 mark
- The intraday trading volume in the LUNC coin is $22.4 Million, indicating a 12% gain.
 Source- Tradingview
With the increased bearishness in the crypto market. the LUNC price has been in a correction phase for the past two weeks. From the $0.0000968 high the coin price tumbled 15% to reach the current trading price of $0.0000822.
With an intraday gain of 1.92%, the coin price hovers above the bottom support of $0.000079. The coin price rebounded several times from this support indicating a strong accumulation zone for investors.
Therefore until this support is intact, the LUNC price may continue to resonate in a sideways trend. The potential reversal could surge the prices by 10% and rechallenges the overhead trendline near $0.00009.
Will Terra Classic Price Correction Reach $0.00007?
In theory, the descending triangle pattern is known as the downtrend continuation pattern which intensifies the market selling pressure upon the breakdown of its $0.000079 neckline. Therefore, a breakdown below $0.000079 will offer buyers an additional barrier to pressure the coin price to a lower level. The post-breakdown fall could plummet the price back to the $0.00007 mark.
Play 10,000+ Casino Games at BC Game with Ease
- Instant Deposits And Withdrawals
- Crypto Casino And Sports Betting
- Exclusive Bonuses And Rewards


Why Trust CoinGape
CoinGape has covered the cryptocurrency industry since 2017, aiming to provide informative insights Read more…to our readers. Our journal analysts bring years of experience in market analysis and blockchain technology to ensure factual accuracy and balanced reporting. By following our Editorial Policy, our writers verify every source, fact-check each story, rely on reputable sources, and attribute quotes and media correctly. We also follow a rigorous Review Methodology when evaluating exchanges and tools. From emerging blockchain projects and coin launches to industry events and technical developments, we cover all facets of the digital asset space with unwavering commitment to timely, relevant information.

Related Articles


- US-Iran War: Reports Confirm Bombings In UAE, Bahrain and Kuwait As Crypto Market Makes Recovery
- XRP Price Dips on US-Iran Conflict, But Capitulation Signals March Rebound
- Crypto Market at Risk as U.S.–Iran War Threatens Inflation With Oil Price Surge
- Polymarket U.S.–Iran Strike Bets Fuel Insider Trading Speculation as Crypto Traders Net $1.2M
- Cardano’s DeFi TVL Climbs as USDCx Stablecoin Launches on Network
- Top Analyst Predicts Pi Network Price Bottom, Flags Key Catalysts
- Will Ethereum Price Hold $1,900 Level After Five Weeks of $563M ETF Selling?
- Top 2 Price Predictions Ethereum and Solana Ahead of March 1 Clarity Act Stablecoin Deadline
- Pi Network Price Prediction Ahead of Protocol Upgrades Deadline on March 1
- XRP Price Outlook As Jane Street Lawsuit Sparks Shift in Morning Sell-Off Trend
- Dogecoin, Cardano, and Chainlink Price Prediction As Crypto Market Rebounds


