 Buy $GGs
LUNC Price Gearing Up for a Major Breakout; $0.0001 Within Reach?


For over a week, the LUNC coin price has been hovering above the multi-month support of $0.00000792 and $0.00000784. Amid the increasing selling pressure in the crypto market, buyers are struggling to rebound to higher levels indicating a weakness in bullish momentum. Will this consolidation trigger a new recovery cycle or set the altcoin for an extended downtrend?
Also Read: Professor Edward Kim Transfers Admin Access To Terra Luna Classic L1TF
LUNC Price Daily Chart
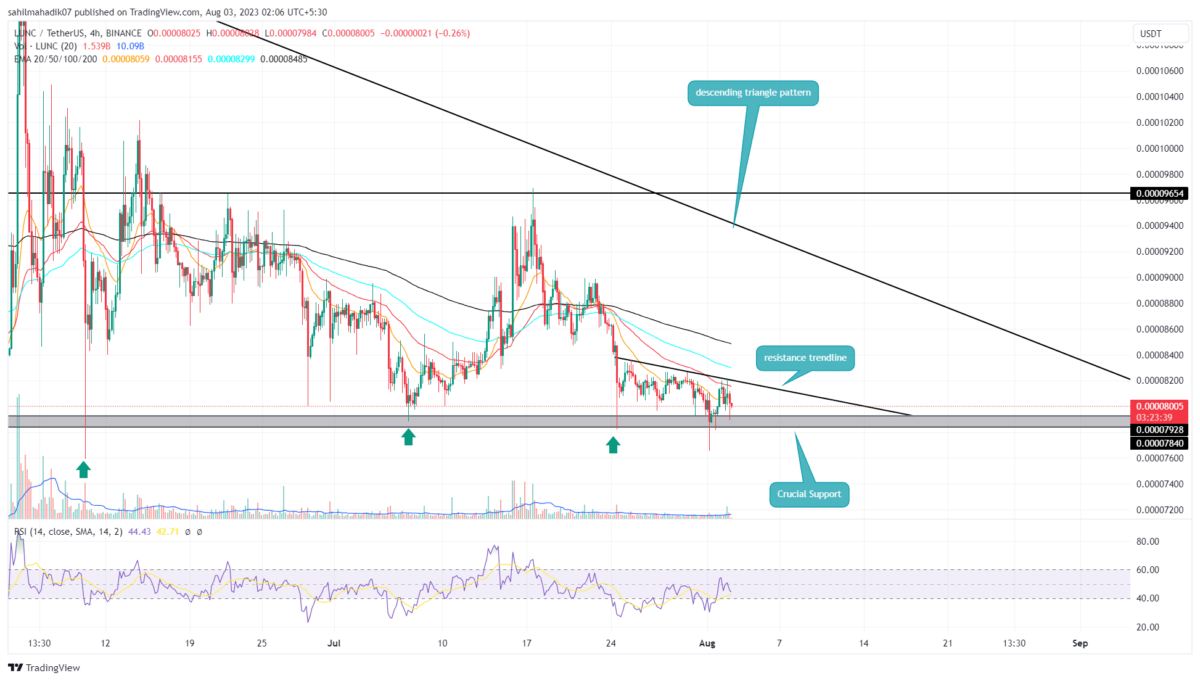
- The descending triangle pattern carries the current sideways action in the LUNC price
- The bullish breakout from the overhead trendline set the LUNC price for a 10% upswing.
- The intraday trading volume in the LUNC coin is $24.9 Million, indicating a 21% gain.
 Source- Tradingview
Amid the ongoing consolidation in LUNC price showcased multiple daily candles with short-bodies and long wicks indicating uncertainty among traders. However, this sideways is getting squeezed within a downsloping trendline and $0.0000792 support.
The 4-hour time frame chart shows the coin price reverted at least thrice from the overhead trendline indicating sellers are aggressive at this dynamic resistance. By the press time, the Terra classic coin price trades at $0.00008, and with an intraday loss of 1.35%, it’s heading back to bottom support.
However, the narrowing range indicates this altcoin is poised for a significant breakout. A bullish breakout from the overhead trendline will boast the market buying pressure and surge the LUNC price 10% up to hit the long-coming downsloping trendline of the triangle pattern.
Will LUNC Price Heading to $0.0001?
The daily time frame chart shows the LUNC price resonating within a descending triangle pattern. The anticipated reversal from $0.00000782 support will trigger an upswing within the boundaries of this pattern. Until the resistance trendline of this pattern is intact the coin holders can expect a sideways trend in action. Therefore, the coin price would need a breakout above the downsloping trendline before hitting $0.0001.
Play 10,000+ Casino Games at BC Game with Ease
- Instant Deposits And Withdrawals
- Crypto Casino And Sports Betting
- Exclusive Bonuses And Rewards


Why Trust CoinGape
CoinGape has covered the cryptocurrency industry since 2017, aiming to provide informative insights Read more…to our readers. Our journal analysts bring years of experience in market analysis and blockchain technology to ensure factual accuracy and balanced reporting. By following our Editorial Policy, our writers verify every source, fact-check each story, rely on reputable sources, and attribute quotes and media correctly. We also follow a rigorous Review Methodology when evaluating exchanges and tools. From emerging blockchain projects and coin launches to industry events and technical developments, we cover all facets of the digital asset space with unwavering commitment to timely, relevant information.

Related Articles


- Crypto Market at Risk as U.S.–Iran War Threatens Inflation With Oil Price Surge
- Polymarket U.S.–Iran Strike Bets Fuel Insider Trading Speculation as Crypto Traders Net $1.2M
- Cardano’s DeFi TVL Climbs as USDCx Stablecoin Launches on Network
- Gold vs. Bitcoin: Can Gold Outperform BTC Amid US–Iran Conflict?
- Bitcoin Faces $1.8B in Panic Selling as U.S.-Iran Airstrikes Escalate; Will BTC Crash Below $60k?
- Top Analyst Predicts Pi Network Price Bottom, Flags Key Catalysts
- Will Ethereum Price Hold $1,900 Level After Five Weeks of $563M ETF Selling?
- Top 2 Price Predictions Ethereum and Solana Ahead of March 1 Clarity Act Stablecoin Deadline
- Pi Network Price Prediction Ahead of Protocol Upgrades Deadline on March 1
- XRP Price Outlook As Jane Street Lawsuit Sparks Shift in Morning Sell-Off Trend
- Dogecoin, Cardano, and Chainlink Price Prediction As Crypto Market Rebounds


