Will this Next Recovery Cycle Push LUNC Price to $0.00014?


In response to increasing uncertainty in the crypto market, the LUNC price shows an evident sideways trend in the daily chart. The short-body candles with higher wicks reflect no initiation from buyers or sellers and a probability of prolonged consolidation. However, despite the market volatility, the traders respect an overhead resistance trendline and bottom trendline of the long-coming wedge pattern. Here’s how market participants can capitalize from this setup.
Also Read: Terra Luna Classic L1 Developer Team Announces Core Upgrade, LUNC To Recover?
LUNC Daily Chart: Key Points
- The formation of a falling wedge pattern reflects a downtrend that is approaching maturity.
- A breakout above the downsloping trendline would set the prices for a 5% upswing
- The intraday trading volume in the LUNC coin is $13.5 Million, indicating a 32% loss.
 Source- Tradingview
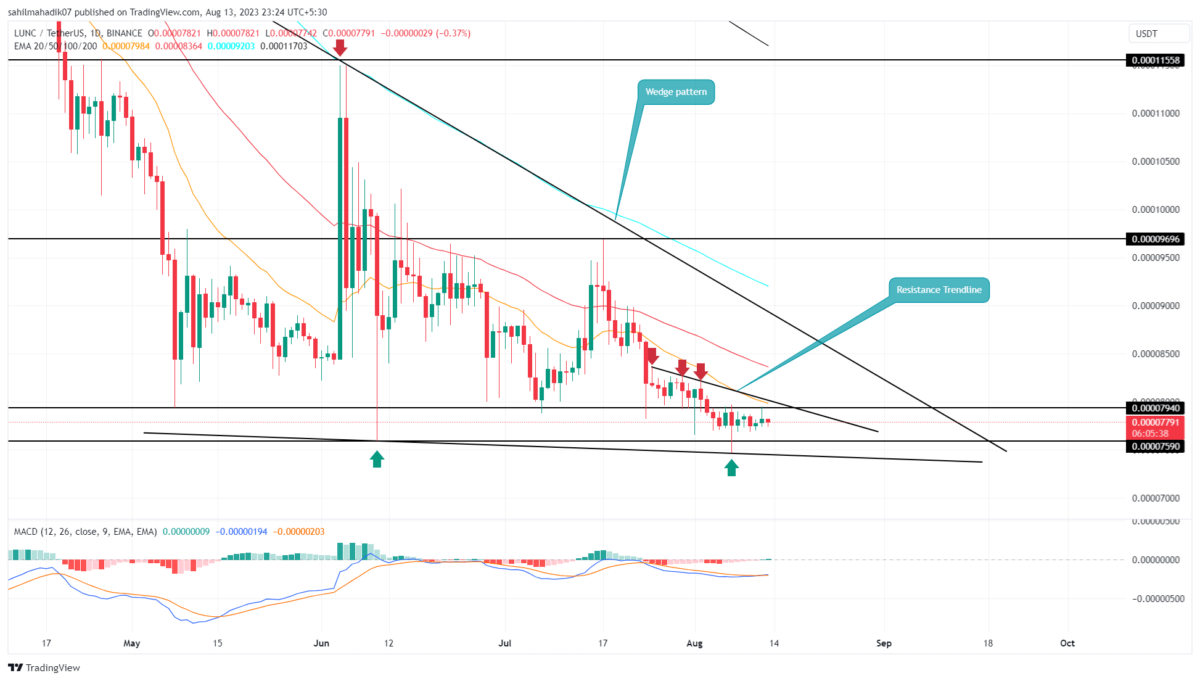
The daily time frame chart shows the Terra classic coin is wobbling in a falling wedge pattern. Amid the July correction in the crypto market, the coin sellers undermined the June recovery and plunged the price back to a lower trendline of $0.000075.
In theory, a retest to the support trendline replenishes the bullish momentum and sets the coin price for a bull cycle within the pattern. However, in response to the increasing uncertainty in the market, the LUNC price went sideways above the lower trendline.
The buyers struggle to rebound despite a push from strong support suggesting weakness in buyers’ commitment. Therefore, the potential traders must wait for a breakout above the overhead trendline, which could give a sufficient signal of bullish reversal.
The post-breakout rally could set the prices for a 5.5% rally and challenge the long-coming resistance trendline of the wedge pattern.
Wedge Pattern offers an Opportunity for Trend Reversal
The falling wedge pattern is also known as the ending diagonal pattern as its converging nature reflects the weakening of bearish momentum. Therefore, even if the LUNC price extends its downtrend within this pattern, the buyers may eventually overthrow sellers for trend control. A bullish breakout from the resistance trendline will signal trend reversal and may set the Terra classic coin for a rally to $0.000144.
- Exponential Moving Average: The 20-day EMA acts as a dynamic resistance to coin buyers,
- Moving Average Convergence Divergence: The flattish MACD(blue) and signal(orange) line accentuate the indecisive nature among traders.
Instant Currency Exchange at BestChange with Ease
- Compare Rates Across 1000+ Exchanges
- Access 250+ Cryptocurrencies & Pairs
- Save Time with Real-Time Price Tracking

Why Trust CoinGape
CoinGape has covered the cryptocurrency industry since 2017, aiming to provide informative insights Read more…to our readers. Our journal analysts bring years of experience in market analysis and blockchain technology to ensure factual accuracy and balanced reporting. By following our Editorial Policy, our writers verify every source, fact-check each story, rely on reputable sources, and attribute quotes and media correctly. We also follow a rigorous Review Methodology when evaluating exchanges and tools. From emerging blockchain projects and coin launches to industry events and technical developments, we cover all facets of the digital asset space with unwavering commitment to timely, relevant information.