Pepe Coin Price Analysis: $PEPE Price See 10% Jump Above this Barrier


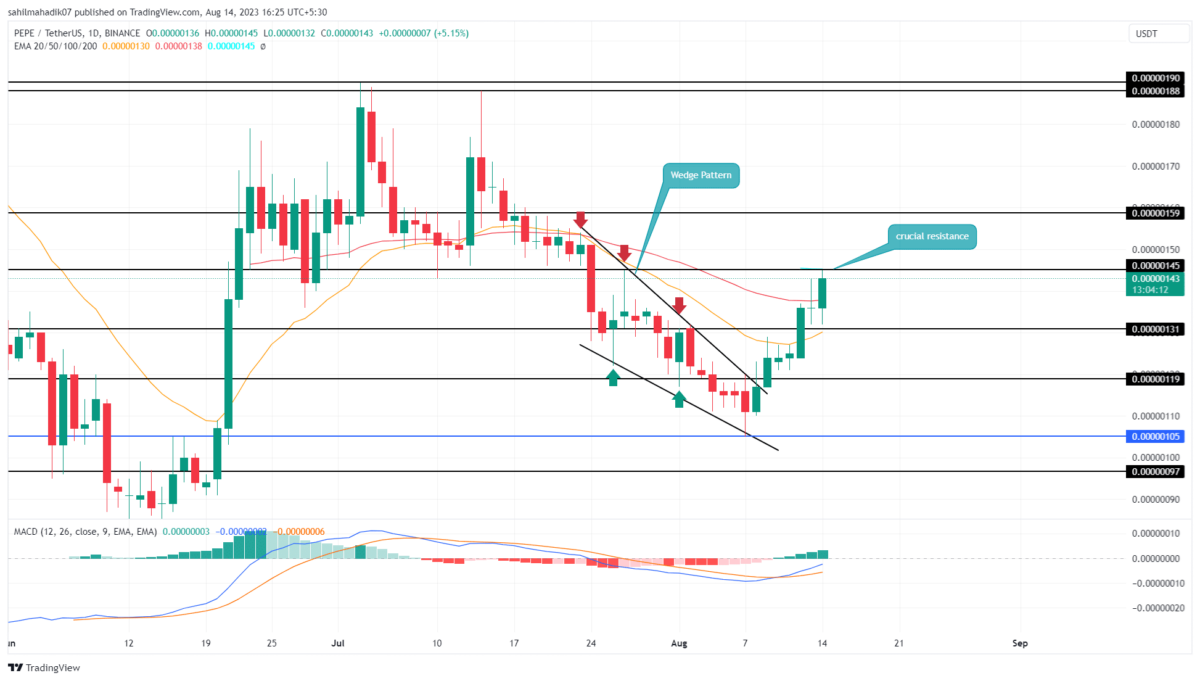
Pepepcoin Price Analysis: On August 8th, the Pepecoin price gave a bullish breakout from the resistance trendline of a falling wedge pattern. This pattern completion signals a trend reversal and triggers a V-shaped recovery in the daily time frame chart. Amid the seven days rally, the prices recorded 30% growth reaching the current price of $0.00000143. Will this recovery extend?
Also Read: Will Pepe Coin (PEPE) Price Reclaim $0.00000155 Milestone?
Pepecoin Price Daily Chart
- A bullish breakout from the $0.00000154 resistance set the PEPE price for a 10% rally
- The coin price reclaimed the 4-hour EMAs(20 and 50) could offer additional support to rising prices.
- The 24-hour trading volume in the Pepecoin coin is $107.5 Million, indicating a 42.5 % loss.
 Source- Tradingview
A V-shaped recovery signals aggressive buying and an attempt from bulls to reclaim trend control. So far the PEPE price rally has reclaimed two significant horizontal resistance of $0.00000120, and $0.00000131.
With an intraday gain of 5.15%, the coin buyers rechallenge the combined resistance of $0.0000145 and 50% Fibonacci retracement level. However, after a sudden rally, the frog-themed memecoin could show a minor retracement to absorb the build-up selling pressure.
If the bullish momentum persists, the crypto buyers could give a breakout from the 0.5 FIB level. Reclaiming this barrier will serve as a crucial signal as buyers have offset 50% region control of the seller.
The post-breakout rally would trigger a quick 10% to $0.0000016.
Can Pepecoin Price Still Resume Downward Trend?
If the anticipated reversal plunged below $0.00000131, the coin holders would still be under the threat of a downtrend continuation. This breakdown may catalyze a 9.5% drop to test the immediate support of $0.0000012.
Instant Currency Exchange at BestChange with Ease
- Compare Rates Across 1000+ Exchanges
- Access 250+ Cryptocurrencies & Pairs
- Save Time with Real-Time Price Tracking


Why Trust CoinGape
CoinGape has covered the cryptocurrency industry since 2017, aiming to provide informative insights Read more…to our readers. Our journal analysts bring years of experience in market analysis and blockchain technology to ensure factual accuracy and balanced reporting. By following our Editorial Policy, our writers verify every source, fact-check each story, rely on reputable sources, and attribute quotes and media correctly. We also follow a rigorous Review Methodology when evaluating exchanges and tools. From emerging blockchain projects and coin launches to industry events and technical developments, we cover all facets of the digital asset space with unwavering commitment to timely, relevant information.