 Buy $GGs
LUNC Price Prediction: Can Channel Pattern Lead to a Spike Beyond $0.000075?


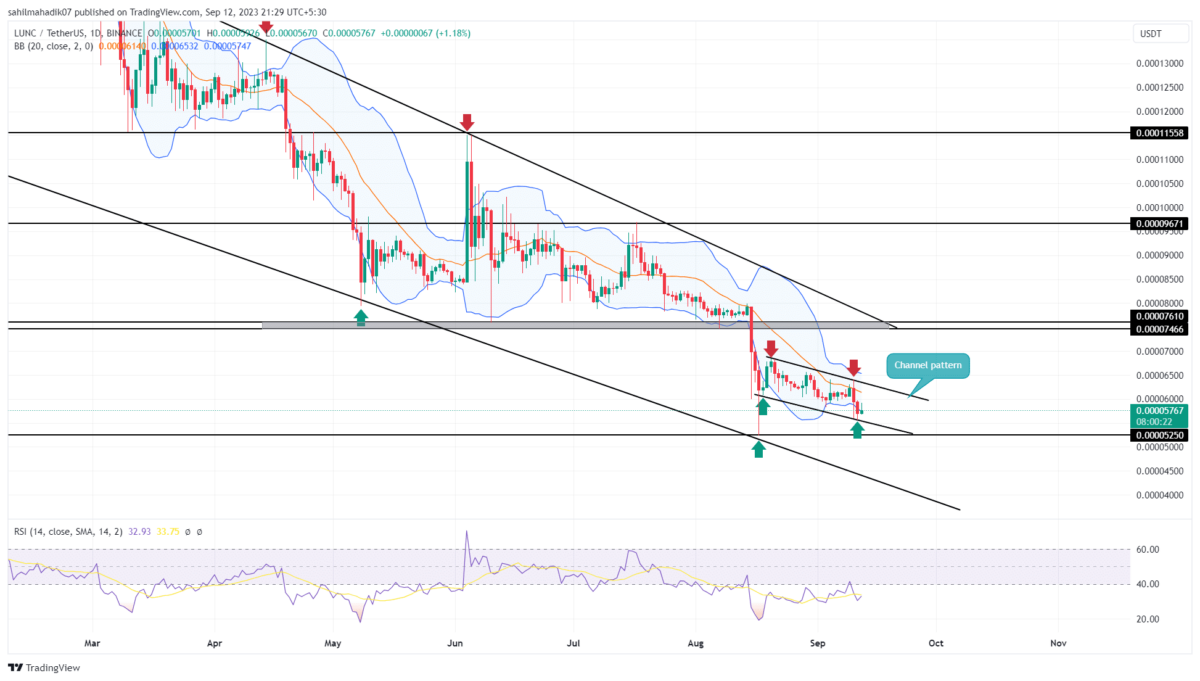
The cryptocurrency market’s present bearish sentiment and increasing FUD have extended the correction trend of many coins in September too, with the LUNC coin being no exception. The altcoin’s daily chart shows a subtle yet consistent decline. Over the last three weeks, Terra Classic coin price has delineated a set of consecutive lower highs and lower lows, comfortably nestled between two parallel trend lines. These trendlines aren’t just mere visual guides; they represent dynamic support and resistance and sketch out the blueprint of a falling channel pattern.
Also Read: Binance Announces Support For Terra Luna Classic (LUNC) Network
Falling Channel Pattern Hints Bullish Upswing Ahead
- A falling channel pattern governs the current downfall in LUNC price
- The bullish breakout from the overhead trendline will set the prices for an 18% upswing.
- The intraday trading volume in the LUNC coin is $16.8 Million, indicating an 8.9% loss.
 Source- Tradingview
The recent cascade of selling in the altcoin realm saw the LUNC price revert from the channel pattern’s upper resistance, situated at $0.000064. This resulted in a swift 13% descent, pushing the coin to retest the lower trend at $0.0000557.
By the press time, the Terra classic coin traded at $0.000057, marking a modest 1% uptick for the day. Traditionally, the falling channel pattern suggests a potential rebound from the support trendline, hinting at a possible resurgence to challenge the upper resistance.
For those eyeing a potential bullish turn, this pattern could present an opportunity. A decisive breakout above the upper resistance could pave the way for LUNC to aim for the $0.000075 zone.
Will the LUNC Price Correction Hit $0.000045?
While the channel remains active, the LUNC price trajectory is predominantly bearish. And even though the pattern historically alludes to potential bullish outcomes, any break below its lower confines could spell trouble. Such a breach would amplify the prevailing bearish sentiment, potentially sending the coin spiraling down to the $0.000045 zone.
- Relative Strength Index: Contrary to the following price action, the daily RSI slope rising indicates growth in the underlying bullish momentum and potential for a bullish reversal.
- Bollinger Band Indicator: The shrunk range of Bollinger Band Indicator reflects the current uncertainty among traders.
Play 10,000+ Casino Games at BC Game with Ease
- Instant Deposits And Withdrawals
- Crypto Casino And Sports Betting
- Exclusive Bonuses And Rewards


Why Trust CoinGape
CoinGape has covered the cryptocurrency industry since 2017, aiming to provide informative insights Read more…to our readers. Our journal analysts bring years of experience in market analysis and blockchain technology to ensure factual accuracy and balanced reporting. By following our Editorial Policy, our writers verify every source, fact-check each story, rely on reputable sources, and attribute quotes and media correctly. We also follow a rigorous Review Methodology when evaluating exchanges and tools. From emerging blockchain projects and coin launches to industry events and technical developments, we cover all facets of the digital asset space with unwavering commitment to timely, relevant information.

Related Articles


- Crypto Market at Risk as U.S.–Iran War Threatens Inflation With Oil Price Surge
- Polymarket U.S.–Iran Strike Bets Fuel Insider Trading Speculation as Crypto Traders Net $1.2M
- Cardano’s DeFi TVL Climbs as USDCx Stablecoin Launches on Network
- Gold vs. Bitcoin: Can Gold Outperform BTC Amid US–Iran Conflict?
- Bitcoin Faces $1.8B in Panic Selling as U.S.-Iran Airstrikes Escalate; Will BTC Crash Below $60k?
- Top Analyst Predicts Pi Network Price Bottom, Flags Key Catalysts
- Will Ethereum Price Hold $1,900 Level After Five Weeks of $563M ETF Selling?
- Top 2 Price Predictions Ethereum and Solana Ahead of March 1 Clarity Act Stablecoin Deadline
- Pi Network Price Prediction Ahead of Protocol Upgrades Deadline on March 1
- XRP Price Outlook As Jane Street Lawsuit Sparks Shift in Morning Sell-Off Trend
- Dogecoin, Cardano, and Chainlink Price Prediction As Crypto Market Rebounds


