 Buy $GGs
Terra Classic Price Prediction: What’s Ahead For $LUNC After Reclaiming $0.00006 Mark?


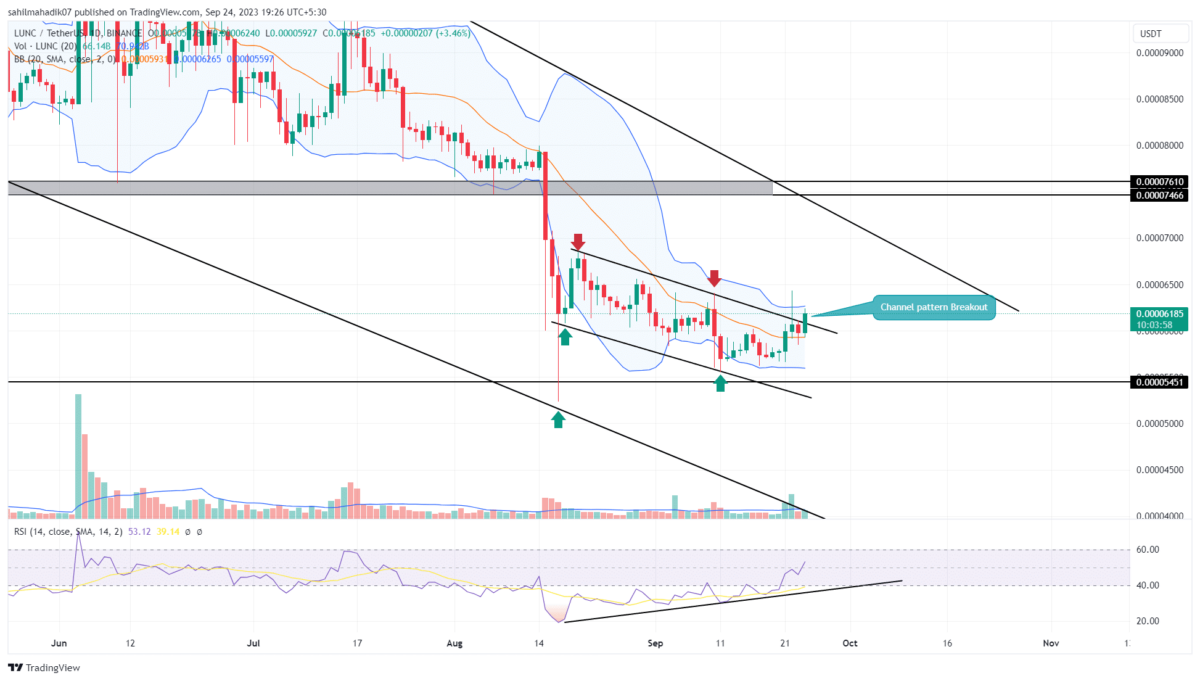
For over a month, the LUNC price correction trend has exhibited a consistent decline in the daily chart. This trajectory is framed by two parallel trend lines, which have acted as dynamic support and resistance. This movement has manifested as a falling channel pattern. Historically, such patterns, especially when nearing a significant low, can signify the potential end of a downtrend, often leading to a notable bullish reversal.
Also Read: Terra Luna Classic (LUNC) Skyrockets 10% Suddenly, Here’s Why
Channel Breakout Sets a 12% Rally
- The coin buyers face an intense supply zone at the overhead trendline
- A bullish breakout from the channel pattern may push the coin price back to the $0.00007 mark.
- The intraday trading volume in the LUNC coin is $20.5 Million, indicating a 8.6% gain.
 Source- Tradingview
On September 22nd, the Terra classic coin price broke through the upper boundary of the channel. However, this optimism was short-lived as the coin retreated below the breached line immediately, showcasing the intense selling pressure.
Today, buoyed by a 2.5% intraday gain, the bulls are once again making an attempt to overthrow the prevailing downtrend. Notably, the previous breakout attempt was accompanied by an increase in trading volume, indicating the buyers will need greater strength to overcome this barrier.
Hence, traders should keep a vigilant eye on the daily candle closely to ascertain if a genuine breakout has occurred. If the breakout is confirmed, the former resistance could pivot into crucial support, potentially propelling the coin on a 14% upward journey to reach $0.00007.
However, the aforementioned $0.00007 currently aligns with the upper trendline of a larger channel pattern exerting a higher supply pressure on this altcoin. Thus, a breakout above this pattern is needed to get better confirmation of trend change.
Can LUNC Price Plunge Back to $0.00005?
sellers continue to apply downward pressure, the LUNC price might face another rebuff at the upper trendline. Should this occur, it could fuel a fresh bearish turn within the channel’s confines. A daily close below the recent low of $0.000058 could see the coin descend roughly 10%, targeting the channel’s lower boundary at $0.000052.
- Bollinger Band: The flattish upper band of the Bollinger band indicator can offer additional resistance
- Relative Strength Index: The constant growth in the daily RSI slope reflects the increasing buying pressure at the bottom trendline.
Play 10,000+ Casino Games at BC Game with Ease
- Instant Deposits And Withdrawals
- Crypto Casino And Sports Betting
- Exclusive Bonuses And Rewards


Why Trust CoinGape
CoinGape has covered the cryptocurrency industry since 2017, aiming to provide informative insights Read more…to our readers. Our journal analysts bring years of experience in market analysis and blockchain technology to ensure factual accuracy and balanced reporting. By following our Editorial Policy, our writers verify every source, fact-check each story, rely on reputable sources, and attribute quotes and media correctly. We also follow a rigorous Review Methodology when evaluating exchanges and tools. From emerging blockchain projects and coin launches to industry events and technical developments, we cover all facets of the digital asset space with unwavering commitment to timely, relevant information.

Related Articles


- Meme Coin Market Dead? Top 5 Reasons Dogecoin, Shiba Inu, and Pepe Are Crashing
- Why Is Crypto Market Crashing Today (Feb 28)
- Breaking: Ethereum Price Drops Amid Israel-Iran Tensions; Machi Big Brother Liquidated Again
- CLARITY Act: Stablecoin Yield Debate Heats Up, but March 1 Deadline Not ‘Do or Die’
- Best Institutional Custody Solutions for Tokenized Assets in 2026
- Top Analyst Predicts Pi Network Price Bottom, Flags Key Catalysts
- Will Ethereum Price Hold $1,900 Level After Five Weeks of $563M ETF Selling?
- Top 2 Price Predictions Ethereum and Solana Ahead of March 1 Clarity Act Stablecoin Deadline
- Pi Network Price Prediction Ahead of Protocol Upgrades Deadline on March 1
- XRP Price Outlook As Jane Street Lawsuit Sparks Shift in Morning Sell-Off Trend
- Dogecoin, Cardano, and Chainlink Price Prediction As Crypto Market Rebounds


