 Buy $GGs
Will LUNC Price Surpass $0.00007? Bullish Pattern Signals a Green Light


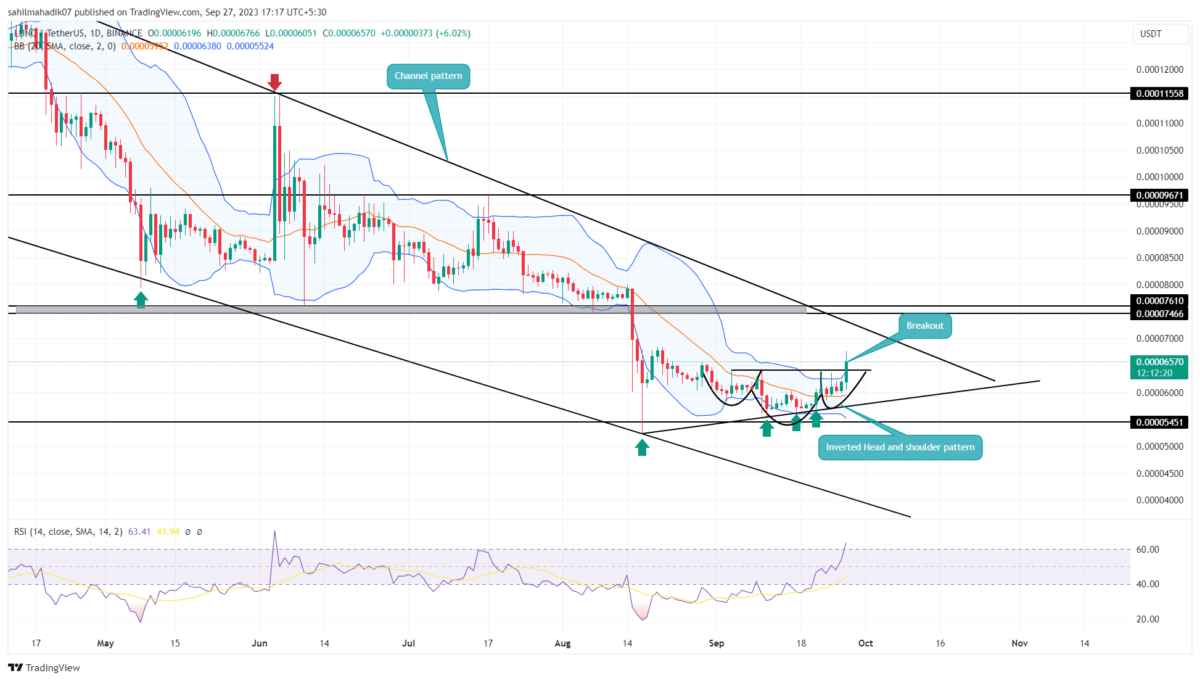
For almost six weeks, the LUNC price has witnessed high volatility, establishing a short-term sideways trend. Within this consolidation period, an ascending support trendline has been acting as a cushion for buyers, preventing the coin from a significant downside. Recently, this trendline served as the base for an inverted head-and-shoulder pattern, signaling a likely bullish turn in the near future.
Also Read: Terra Luna Classic Community Votes To Reset Validator Commission; LUNC To Rally?
Chart Pattern Hints a Quick 6% Jump
- A bullish reversal pattern sets the LUNC price for a significant upswing.
- The rising price may face renewed selling pressure around $0.00007
- The intraday trading volume in the LUNC coin is $35.2 Million, indicating a 211% gain.
 Source- Tradingview
As the leading cryptocurrency Bitcoin faced a pullback from the $27,500 level, the Terra classic coin price also experienced selling pressure, particularly around the $0.000064 mark. In addition, the daily chart reveals that this level serves as the neckline for the aforementioned bullish reversal head-and-shoulder pattern.
This pattern is often observed at market bottoms and usually precedes significant upswings. At the time of writing, the LUNC price is trading at $0.000069, with an intraday gain of 8%. With this bullish uptick, the coin price gave a decisive breakout from the $0.000064 resistance, offering a strong foundation for bullish momentum.
A confirmed breakout could potentially lead to a 6% surge, targeting the $0.00007 mark. However, this aforementioned level wavering the resistance trendline of the channel pattern creates a zone of high supply pressure.
Is Current Recovery Sustainable?
The overhead resistance trendline is part of a longer-term channel pattern that has dictated the price behavior of this altcoin for over six months. Given the impending bullish activity, traders should prepare for potential resistance turning into supply pressure. At this juncture, any failure to break above this trendline could lead the coin back into the confines of its long-standing channel pattern, prompting another correction. Thus, a decisive bullish breakout is essential for initiating a sustained recovery in the LUNC coin.
- Bollinger Band: An uptick in the upper band of the Bollinger band indicator suggests a high momentum buying.
- Relative Strength Index: The daily RSI slope rising above 60% accentuates recovery sentiment among traders.
Play 10,000+ Casino Games at BC Game with Ease
- Instant Deposits And Withdrawals
- Crypto Casino And Sports Betting
- Exclusive Bonuses And Rewards


Why Trust CoinGape
CoinGape has covered the cryptocurrency industry since 2017, aiming to provide informative insights Read more…to our readers. Our journal analysts bring years of experience in market analysis and blockchain technology to ensure factual accuracy and balanced reporting. By following our Editorial Policy, our writers verify every source, fact-check each story, rely on reputable sources, and attribute quotes and media correctly. We also follow a rigorous Review Methodology when evaluating exchanges and tools. From emerging blockchain projects and coin launches to industry events and technical developments, we cover all facets of the digital asset space with unwavering commitment to timely, relevant information.

Related Articles


- Why Is Crypto Market Crashing Today (Feb 28)
- Breaking: Ethereum Price Drops Amid Israel-Iran Tensions; Machi Big Brother Liquidated Again
- CLARITY Act: Stablecoin Yield Debate Heats Up, but March 1 Deadline Not ‘Do or Die’
- Best Institutional Custody Solutions for Tokenized Assets in 2026
- Minnesota Considers Ban on Bitcoin and Crypto ATMs as Scam Reports Rise
- Top Analyst Predicts Pi Network Price Bottom, Flags Key Catalysts
- Will Ethereum Price Hold $1,900 Level After Five Weeks of $563M ETF Selling?
- Top 2 Price Predictions Ethereum and Solana Ahead of March 1 Clarity Act Stablecoin Deadline
- Pi Network Price Prediction Ahead of Protocol Upgrades Deadline on March 1
- XRP Price Outlook As Jane Street Lawsuit Sparks Shift in Morning Sell-Off Trend
- Dogecoin, Cardano, and Chainlink Price Prediction As Crypto Market Rebounds


