 Buy $GGs
Will the Current Correction Push LUNC Price Below $0.00005?


Over the past two months, the LUNC price has been on a turbulent ride, with substantial price swings but no contribution to any particular trend. However, the altcoin market’s recent downturn has pushed this crypto into a bearish phase, dropping it from a high of $0.000067 to its current price of $0.00005684. This 16% loss over the last three weeks wiped out September’s gains. Will the ongoing correction trend extend below $0.00005?
Also Read: Terra Luna Classic Community Moves Closer To Burning 800 Million USTC
Will the Downtrend Continue?
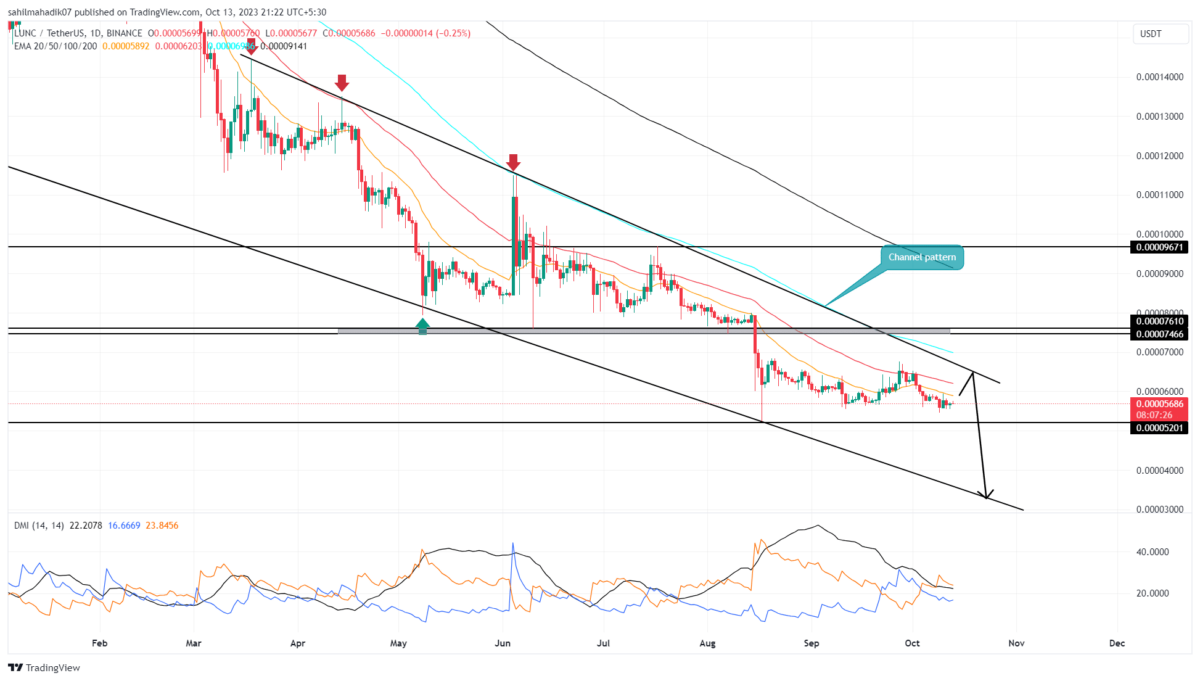
- The LUNC price may witness a high supply pressure at the upper trendline of the channel pattern.
- The coin price below daily EMAs(20, 50, 100, and 200) signals an established downtrend
- The intraday trading volume in the LUNC coin is $9.6 Million, indicating a 13% loss
 Source- Tradingview
While the current behavior of Terra Classic coin price shows uncertainty and indecisiveness in the market, the dominant trend in this asset remains bearish. Investors can follow this downward trajectory using the two trendlines of a falling channel pattern.
By the price time, the LUNC price trades at $0.000057, and with an insignificant gain of 0.04%, it will likely continue with its ongoing sideways trajectory. Even with the sideways trend prolonged, the downsloping trendline would soon hit the coin price which may put additional supply pressure on the traders.
Historically, this trendline has constantly eradicated the buyer’s attempt to recover higher, indicating the sellers aggressively defend this level. Therefore, the newfound supply pressure at this dynamic resistance will likely push the altcoin below the psychological support of $0.00005.
However, as per the Dow Theory, trends are subject to change, so investors bullish on the LUNC coin should watch for a breakout from the channel pattern as a potential entry point.
LUNC vs BTC Performance
 Source: Coingape| Terra Classic Vs Bitcoin Price
Interestingly, the Terra Classic coin has been diverging from the leading cryptocurrency Bitcoin since the latter half of August. While Bitcoin price has shown signs of a new recovery rally with its higher low formation on the daily chart, the LUNC price continues to print lower highs and lower lows, reinforcing its independent, downward trajectory
- Directional Movement Index: A bearish crossover state between the DI+(blue) and DI-(orange) slope reflects the active selling sentiment in the market.
- Exponential Moving Average: the 20-and-50-day EMA slope acts as dynamic resistance for LUNC.
Play 10,000+ Casino Games at BC Game with Ease
- Instant Deposits And Withdrawals
- Crypto Casino And Sports Betting
- Exclusive Bonuses And Rewards


Why Trust CoinGape
CoinGape has covered the cryptocurrency industry since 2017, aiming to provide informative insights Read more…to our readers. Our journal analysts bring years of experience in market analysis and blockchain technology to ensure factual accuracy and balanced reporting. By following our Editorial Policy, our writers verify every source, fact-check each story, rely on reputable sources, and attribute quotes and media correctly. We also follow a rigorous Review Methodology when evaluating exchanges and tools. From emerging blockchain projects and coin launches to industry events and technical developments, we cover all facets of the digital asset space with unwavering commitment to timely, relevant information.

Related Articles


- Cardano’s DeFi TVL Climbs as USDCx Stablecoin Launches on Network
- Gold vs. Bitcoin: Can Gold Outperform BTC Amid US–Iran Conflict?
- Bitcoin Faces $1.8B in Panic Selling as U.S.-Iran Airstrikes Escalate; Will BTC Crash Below $60k?
- Gold ETF vs Tokenized Gold: Who Could Outperform in 2026?
- Crypto Weekly Wrap: Jane Street Targeted After Terra Suit, Vitalik’s ETH Selloffs, Regulatory Progress Feb 23-27
- Top Analyst Predicts Pi Network Price Bottom, Flags Key Catalysts
- Will Ethereum Price Hold $1,900 Level After Five Weeks of $563M ETF Selling?
- Top 2 Price Predictions Ethereum and Solana Ahead of March 1 Clarity Act Stablecoin Deadline
- Pi Network Price Prediction Ahead of Protocol Upgrades Deadline on March 1
- XRP Price Outlook As Jane Street Lawsuit Sparks Shift in Morning Sell-Off Trend
- Dogecoin, Cardano, and Chainlink Price Prediction As Crypto Market Rebounds


