Avalanche, MATIC And FTT Shoot Up By Almost 9%: Next Trading Levels


The crypto market is back with a bullish action post undergoing a price correction very recently. This month overall has been quite volatile for the majority of cryptocurrencies.
Bitcoin zoomed up by almost 6% at press time and was trading above the $48k mark, which reflected across the industry’s altcoins. Today’s global cryptocurrency market cap is $2.37 Trillion, a 4.7% positive change in the last 24 hours. Among the coins that shot up by almost 9% were Avalanche, MATIC, and FTX Token.
Avalanche/USD Four Hour Chart
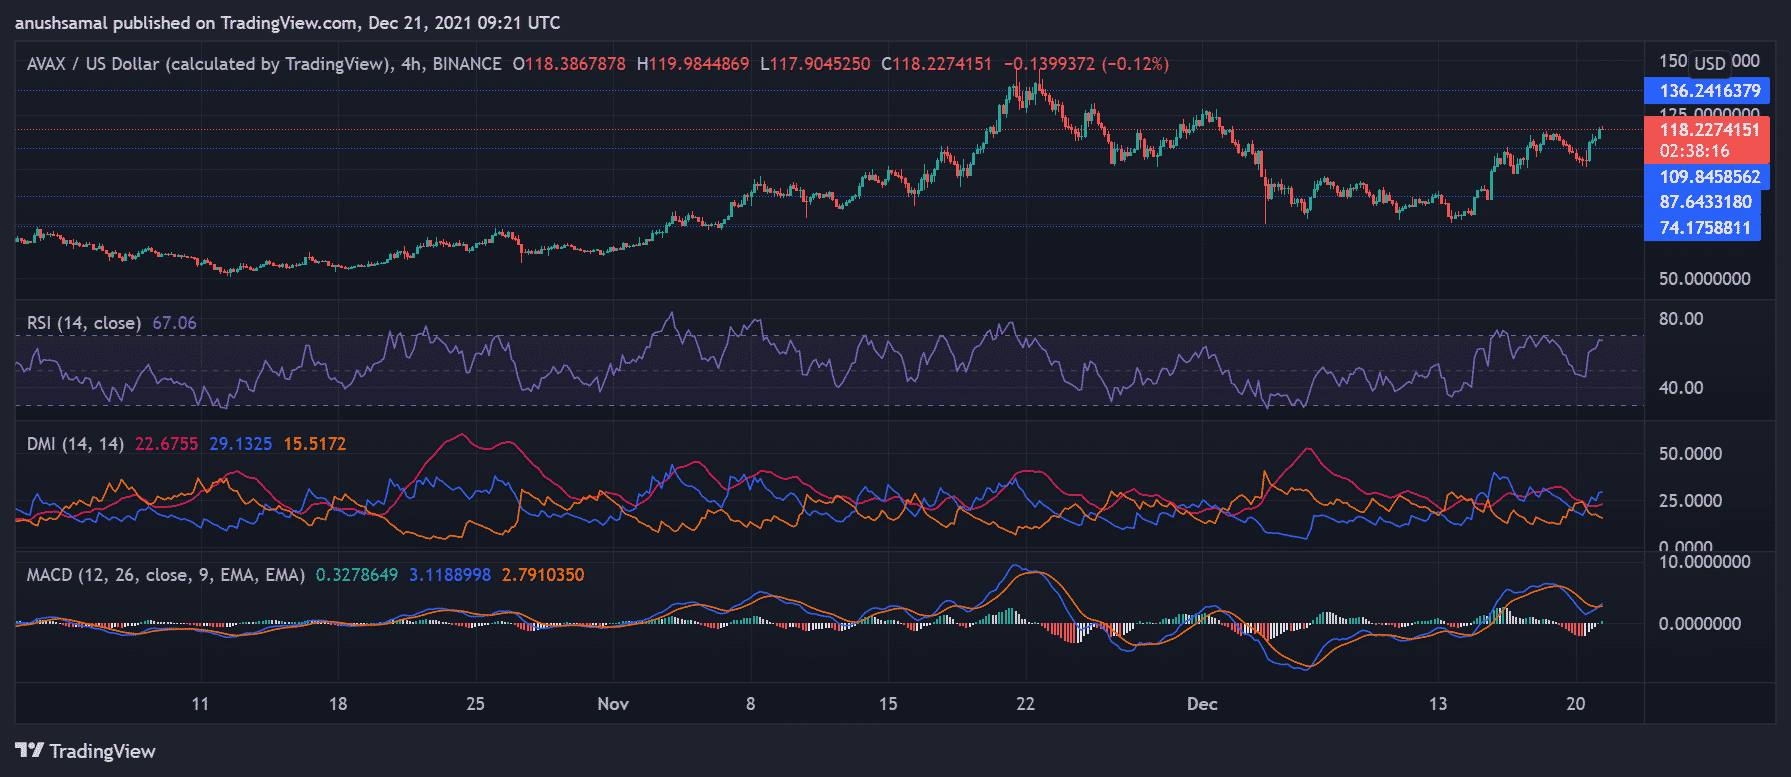
Avalanche’s price action has soared a couple of times this week; over the last 24 hours, the bulls embarked on yet another upward ride as it logged in a 10.1% gain. At press time, the coin was trading at $118.22. In the last week, AVAX registered a massive ROI of 50%. The chart shows that AVAX has held itself well above its strong support line of $74.17.
Immediate price resistance stood at $136.24, and on the flip side, the support level stood at $109.84. The Relative Strength Index retouched the overbought mark as the asset overvalued at the time of writing.
The Directional Movement Index was positive as the +DI line crossed over the -DI line indicating lessened selling pressure. MACD chose the bulls as the indicator displayed green signal bars. The chances of a price pullback cannot be overruled if the coin might trade near $109.84 and $87.64.
MATIC/USD Four-Hour Chart
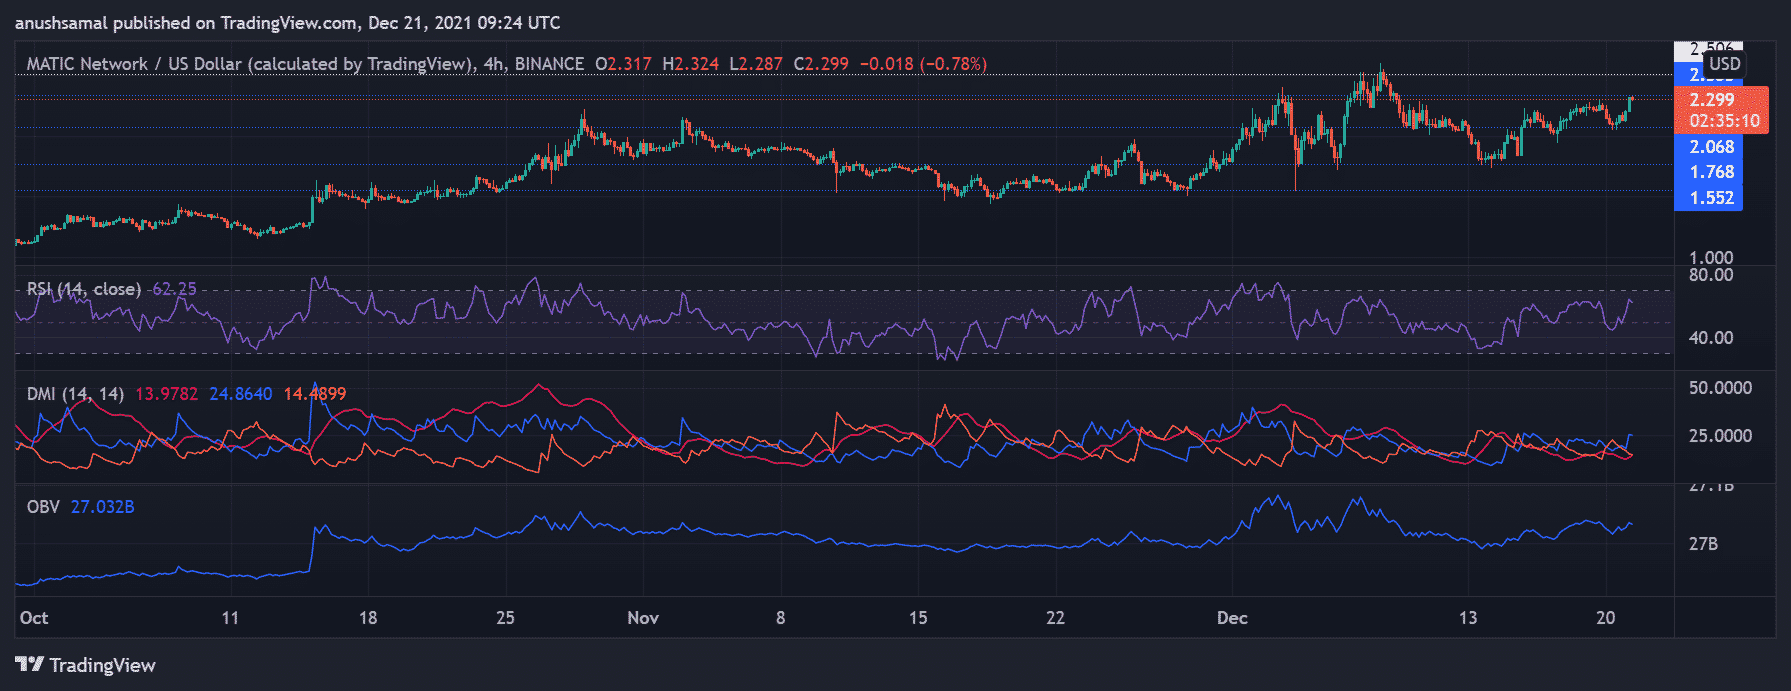
Matic’s price action over the month was quite dynamic as the coin dipped and propelled right after quite a several times. At the time of writing, the coin was exchanging hands at $2.29. The overhead price resistance was at $2.70, and a fall below the current price level would cause MATIC to trade near the immediate price floor of $2.06.
The bullish price action has caused buyers to exceed sellers in the market. MATIC secured a 30% ROI in the past week.
The Relative Strength Index was heading towards the overbought zone as the buyers have re-entered the market, and so the indicators continued to favor the bulls. The Directional Movement Index affirmed the increased bullish power while the On Balance Volume displayed increased buying pressure.
FTT/USD Four-Hour Chart
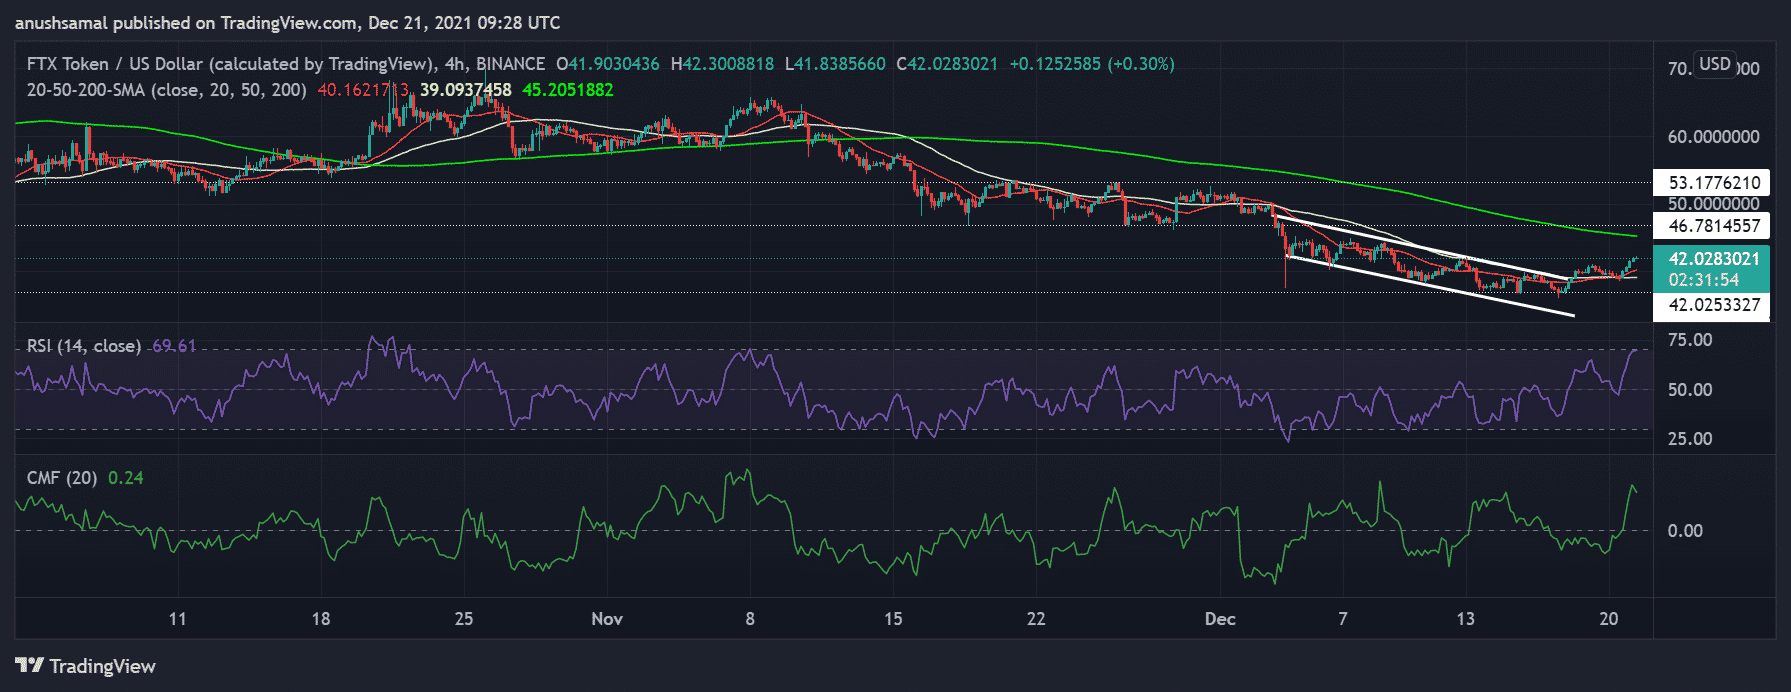
After trading within a descending channel in the last week and a half traded within a descending channel, and then the coin broke into an upward direction. Over the previous 24 hours, the coin soared over 9%. However, the coin displayed a 6.7% appreciation at press time and was trading at $42.02.
Increased bullish pressure can push the coin upwards near $46.78. The price of the FTX token was above the 20-SMA line, which signified that buyers had dictated the price movement in the market.
After almost a month, the Relative Strength Index has touched the overbought territory, and a price pullback could occur in the upcoming trading sessions. Chaikin Money Flow went up above the midline as capital inflows exceeded capital outflows, although the indicator noted a downtick indicating a possible fall in capital inflows.

Why Trust CoinGape
CoinGape has covered the cryptocurrency industry since 2017, aiming to provide informative insights Read more… to our readers. Our journal analysts bring years of experience in market analysis and blockchain technology to ensure factual accuracy and balanced reporting. By following our Editorial Policy, our writers verify every source, fact-check each story, rely on reputable sources, and attribute quotes and media correctly. We also follow a rigorous Review Methodology when evaluating exchanges and tools. From emerging blockchain projects and coin launches to industry events and technical developments, we cover all facets of the digital asset space with unwavering commitment to timely, relevant information.

Delivered every day.
- Insights that move markets
- 100,000 active subscribers
Related Articles


- Trump Tariffs: U.S. Threatens Higher Tariffs After Supreme Court Ruling, BTC Price Falls
- Fed’s Chris Waller Says Support For March Rate Cut Will Depend On Jobs Report
- Breaking: Tom Lee’s BitMine Adds 51,162 ETH Amid Vitalik Buterin’s Ethereum Sales
- Breaking: Michael Saylor’s Strategy Makes 100th Bitcoin Purchase, Buys 592 BTC as Market Struggles
- Satoshi-Era Whale Dumps $750M BTC as Hedge Funds Pull Out Billions in Bitcoin
- COIN Stock Risks Crashing to $100 as Odds of US Striking Iran Jump
- MSTR Stock Price Predictions As Michael Saylor’s Strategy Makes 100th BTC Purchase
- Top 3 Meme Coins Price Prediction As BTC Crashes Below $67k
- Top 4 Reasons Why Bitcoin Price Will Crash to $60k This Week
- COIN Stock Price Prediction: Will Coinbase Crash or Rally in Feb 2026?
- Shiba Inu Price Feb 2026: Will SHIB Rise Soon?


