 Buy Presale
BULLISH: Bitcoin HODLers Give Signal Of A Potential 20X Price Growth In 5 Years


Holders of Bitcoin (BTC) are regaining the strong hands as the number of coins held for 2 – 3 years soars to 15.10% of the total mined coins. This figure was last recorded in late 2015 when the price of BTC traded at $350’s level which signals a possible 20 X boost in price in the coming five years if history does repeat itself.
The HODL waves model
Bitcoin uses a weird kind of structure called the unspent transaction model which shows the last time a coin was used in a transaction. This UXTO model has allowed researchers to classify the cryptocurrency in waves of time the coin has spent in a dormant wallet account. The chart below shows the short term (warm) waves of UXTO i.e. 1-day, 1-week, 1-month bands and the longer-term (cooler) waves i.e. more than a year, 2-3 year waves, 3-5 year waves and those held over 5 years.
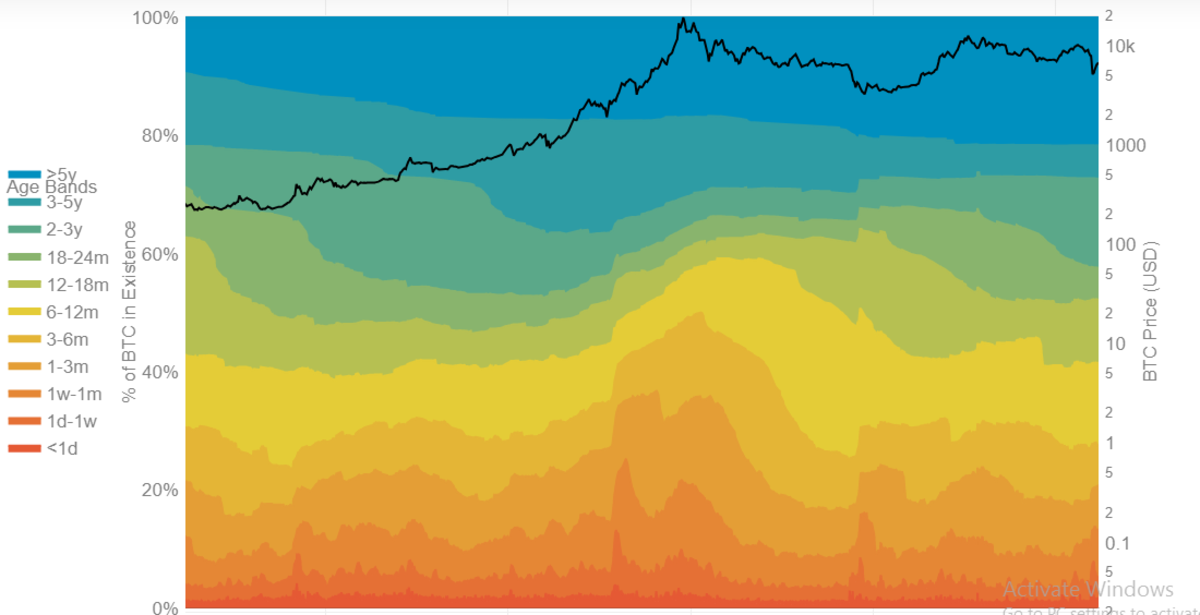
The chart offers a relationship between the two periods and their reaction to different market participants’ behavior during high and low price cycles of BTC.
Strong hands signal possible long term bullish run
The two year to three year HODL wave is currently on a four year high at 15.10%, representing 2.74 million coin UXTOs of BTC. This signals an increasing portion of HODLing despite recent volatile pressures on price as it fell to $3,800 through March. This ranks only below the >5year HODL wave that holds 21% of the total mined tokens.
Fun Fact: The last time the 2-3 year HODL Wave age band represented ~15% (2.25m) of available #BTC was November 2015, when BTC was $345
Today, ~15% (2.74m) of all BTC has been sitting idle for 2-3 years, and the price is ~$6,500 https://t.co/by2nmlXQIJ pic.twitter.com/eum0itEzbI
— Unchained Capital (@unchainedcap) March 31, 2020
The insistence against selling further shows the belief in the market participants in the asset which has seen its price skyrocket in the past few years. Trading at $354, the last time so much BTC was held for at least two years, the price exploded in the two years that followed hitting an all-time high of $19,800 before retracing to current levels at $6,300.
Can history repeat itself?
Markets are fluid but normally follow historical patterns, reacting the same under similar fundamentals. With the halving coming up this May, could BTC experience a similar boost to what happened in 2015-2017?
As more BTC is held for longer period of time, disregarding the overall market movements, confidence in the asset grows as a store of value. This may set the coin on a magical run once more with a 20X price increase possible in the next half a decade. Can BTC hit $120,000 by 2025?
(Images from Unchained Capital)
Play 10,000+ Casino Games at BC Game with Ease
- Instant Deposits And Withdrawals
- Crypto Casino And Sports Betting
- Exclusive Bonuses And Rewards


Why Trust CoinGape
CoinGape has covered the cryptocurrency industry since 2017, aiming to provide informative insights Read more… to our readers. Our journal analysts bring years of experience in market analysis and blockchain technology to ensure factual accuracy and balanced reporting. By following our Editorial Policy, our writers verify every source, fact-check each story, rely on reputable sources, and attribute quotes and media correctly. We also follow a rigorous Review Methodology when evaluating exchanges and tools. From emerging blockchain projects and coin launches to industry events and technical developments, we cover all facets of the digital asset space with unwavering commitment to timely, relevant information.

Delivered every day.
- Insights that move markets
- 100,000 active subscribers
Related Articles


- Ripple Bets On AI Boom With Strategic Investment In AI Agent Infrastructure Startup
- Prediction Market News: Kalshi Fines MrBeast Associate Over Insider Trading Amid State Crackdown
- CLARITY Act: Banks, Crypto Yet To Agree On New Crypto Bill Draft As March 1 Deadline Looms
- Michael Saylor Predicts $50T From Bonds Could Flow Into Bitcoin Ecosystem as Digital Credit Evolves
- Bitcoin Treasury Firm GD Culture Authorizes Sale of 7,500 BTC as Expert Warns Of More ‘Pain’
- Dogecoin, Cardano, and Chainlink Price Prediction As Crypto Market Rebounds
- Will Solana Price Rally to $100 If Bitcoin Reclaims $72K?
- XRP Price Eye $2 Rebound as On-Chain Data Signals Massive Whale Accumulation
- Ethereum Price Reclaims $2K- New Rally Ahead or a Temporary Bounce?
- COIN Stock Price Prediction as Wall Street Pros Forecast a 62% Surge
- Cardano Price Signals Rebound as Whales Accumulate 819M ADA


