
Highlights
Bitcoin price today trades at $100,157.0 on 11 PM after hitting a daily high of $102,528.0 today after a -1.18% move on March 19.
Regardless of the recent market crashes Bitcoin price today is up -1.18% and trades at $100,157.0. With this optimism back, investors can expect altcoins to rally.

*bitcoin price updated as of 11 PM.
Value of BTC trades at $100,157.0, bringing the year-to-date gain from 56% on October 20 to roughly 135% as of March 19. The YTD performance has slumped due to the recent BTC crash. Although many altcoins have shot up over triple digits, Bitcoin is catching up. Ethereum price’s YTD performance is lackluster, stands around 70%, and is well below BTC.
Although Bitcoin is the largest cryptocurrency by market capitalization, Bitcoin’s popularity is due to its first-mover advantage and its being a secure, decentralized network. In addition, many narratives, like digital gold, inflation hedges, and uncorrelated assets, have kept BTC at the forefront of the crypto market since its inception in 2009.
Industry veterans’ speculation of a bull run post-US elections was right, and Bitcoin is likely to end November 2024 on a positive note. Many even expect a six-digit target for BTC by the end of November, and this is due to the historical returns. History shows that Bitcoin has always performed massively in the fourth quarter.

With that said, if Bitcoin price hits a new ATH in November or December, Bitcoin’s market capitalization, which stands at $1,982.7 billion, could finally hit the $2 trillion mark.

While Bitcoin’s market cap hovers around $1,982.7 billion, with Ethereum, the duo controls nearly 65% of the total cryptocurrency market capitalization. Despite the seven-month consolidation, Bitcoin’s $1.93 trillion market cap remains strong, anticipating it reaching $2 trillion before 2025.
Being the top crypto has its benefits; more people tend to flock toward the asset. Likewise, BTC’s 24-hour trading volume stands at $69.5 billion. Binance, one of the largest cryptocurrency exchanges, contributes a major portion of this volume. Binance’s share of BTC’s 24-hour trading volume comprises spot and perpetuals trading. While spot volume hovers around 11%, perpetual volume is 41%. Exchanges like OKX, Bitget, etc, follow Binance.
With a market cap of $1.93 trillion, it is necessary for the network to remain secure, decentralized, and scalable. This is possible by upgrading the Bitcoin network regularly.
Here are some notable upgrades the Bitcoin network has received or planned to receive since its inception in 2009.
Here are some key milestone upgrades to the Bitcoin network over the past decade.
2020-2024:
2017-2019:
2015-2016:
2013-2014:
2010-2012:
2009-2010:
| Date | Price | Change |
|---|---|---|
| March 18, 2026 | 74487.43 | 0.91% |
| March 19, 2026 | 75404.55 | 2.15% |
| March 20, 2026 | 76321.67 | 3.4% |
| March 21, 2026 | 77406.01 | 4.87% |
| March 22, 2026 | 78686.66 | 6.6% |
| March 23, 2026 | 79967.30 | 8.34% |
| March 24, 2026 | 80937.97 | 9.65% |
| March 25, 2026 | 81881.69 | 10.93% |
| March 26, 2026 | 82333.07 | 11.54% |
| March 27, 2026 | 81981.18 | 11.06% |
| March 28, 2026 | 81629.28 | 10.59% |
| March 29, 2026 | 81054.95 | 9.81% |
| March 30, 2026 | 80438.24 | 8.97% |
| March 31, 2026 | 80059.99 | 8.46% |
| April 01, 2026 | 80238.14 | 8.7% |
| April 02, 2026 | 80416.29 | 8.94% |
| April 03, 2026 | 80707.38 | 9.34% |
| April 04, 2026 | 81034.13 | 9.78% |
| April 05, 2026 | 81279.05 | 10.11% |
| April 06, 2026 | 81233.80 | 10.05% |
| April 07, 2026 | 81188.55 | 9.99% |
| April 08, 2026 | 81052.09 | 9.81% |
| April 09, 2026 | 80872.70 | 9.56% |
| April 10, 2026 | 80697.24 | 9.33% |
| April 11, 2026 | 80545.88 | 9.12% |
| April 12, 2026 | 80394.51 | 8.91% |
| April 13, 2026 | 80343.01 | 8.85% |
| April 14, 2026 | 80358.08 | 8.87% |
| April 15, 2026 | 80321.91 | 8.82% |
| April 16, 2026 | 79482.82 | 7.68% |
Based on Coingape’s Bitcoin price prediction, investors can expect a double-digit rally that leads to a peak of $108,918 as of December 31. While there may be a brief correction, BTC’s trend remains bullish. Bitcoin Price Forecast Between 2025 and 2029
| Month | Minimum Price | Average Price | Maximum Price | Potential ROI |
|---|---|---|---|---|
| January | $81,272.04 | $91,052.87 | $96,407.22 | 30.6% |
| February | $77,581.50 | $89,991.84 | $96,244.67 | 30.4% |
| March | $73,890.96 | $88,930.81 | $96,082.12 | 30.2% |
| April | $70,200.41 | $87,869.78 | $95,919.57 | 29.9% |
| May | $66,509.87 | $86,808.76 | $95,757.01 | 29.7% |
| June | $62,819.33 | $85,747.73 | $95,594.46 | 29.5% |
| July | $59,128.79 | $84,686.70 | $95,431.91 | 29.3% |
| August | $55,438.24 | $83,625.67 | $95,269.36 | 29.1% |
| September | $51,747.70 | $82,564.64 | $95,106.81 | 28.8% |
| October | $48,057.16 | $81,503.61 | $94,944.26 | 28.6% |
| November | $44,366.62 | $80,442.58 | $94,781.71 | 28.4% |
| December | $40,676.07 | $79,381.56 | $94,619.16 | 28.2% |
| All Time | $60,974.06 | $85,217.21 | $95,513.19 | 29.4% |
| Month | Minimum Price | Average Price | Maximum Price | Potential ROI |
|---|---|---|---|---|
| January | $55,370.29 | $72,672.30 | $93,693.37 | 26.9% |
| February | $54,929.32 | $75,743.88 | $98,121.92 | 32.9% |
| March | $54,488.36 | $78,815.46 | $102,550.48 | 38.9% |
| April | $54,047.39 | $81,887.04 | $106,979.03 | 44.9% |
| May | $53,606.43 | $84,958.61 | $111,407.59 | 50.9% |
| June | $53,165.46 | $88,030.19 | $115,836.14 | 56.9% |
| July | $52,724.50 | $91,101.77 | $120,264.70 | 62.9% |
| August | $52,283.53 | $94,173.34 | $124,693.25 | 68.9% |
| September | $51,842.57 | $97,244.92 | $129,121.81 | 74.9% |
| October | $51,401.60 | $100,316.50 | $133,550.37 | 80.9% |
| November | $50,960.64 | $103,388.07 | $137,978.92 | 86.9% |
| December | $50,519.68 | $106,459.65 | $142,407.48 | 92.9% |
| All Time | $52,944.98 | $89,565.98 | $118,050.42 | 59.9% |
| Month | Minimum Price | Average Price | Maximum Price | Potential ROI |
|---|---|---|---|---|
| January | $58,478.62 | $116,315.21 | $156,059.10 | 111.4% |
| February | $66,437.56 | $126,170.78 | $169,710.72 | 129.9% |
| March | $74,396.51 | $136,026.34 | $183,362.34 | 148.4% |
| April | $82,355.45 | $145,881.90 | $197,013.96 | 166.9% |
| May | $90,314.39 | $155,737.46 | $210,665.58 | 185.4% |
| June | $98,273.34 | $165,593.03 | $224,317.20 | 203.9% |
| July | $106,232.28 | $175,448.59 | $237,968.82 | 222.4% |
| August | $114,191.22 | $185,304.15 | $251,620.44 | 240.9% |
| September | $122,150.17 | $195,159.71 | $265,272.06 | 259.4% |
| October | $130,109.11 | $205,015.28 | $278,923.68 | 277.9% |
| November | $138,068.05 | $214,870.84 | $292,575.30 | 296.4% |
| December | $146,027 | $224,726.40 | $306,226.92 | 314.9% |
| All Time | $102,252.81 | $170,520.81 | $231,143.01 | 213.1% |
| Month | Minimum Price | Average Price | Maximum Price | Potential ROI |
|---|---|---|---|---|
| January | $146,654.12 | $220,464.70 | $298,227.81 | 304% |
| February | $147,281.25 | $216,202.99 | $290,228.70 | 293.2% |
| March | $147,908.37 | $211,941.29 | $282,229.59 | 282.4% |
| April | $148,535.50 | $207,679.59 | $274,230.48 | 271.5% |
| May | $149,162.62 | $203,417.88 | $266,231.36 | 260.7% |
| June | $149,789.74 | $199,156.18 | $258,232.25 | 249.8% |
| July | $150,416.87 | $194,894.47 | $250,233.14 | 239% |
| August | $151,043.99 | $190,632.77 | $242,234.03 | 228.2% |
| September | $151,671.12 | $186,371.07 | $234,234.92 | 217.3% |
| October | $152,298.24 | $182,109.36 | $226,235.81 | 206.5% |
| November | $152,925.36 | $177,847.66 | $218,236.70 | 195.7% |
| December | $153,552.49 | $173,585.95 | $210,237.59 | 184.8% |
| All Time | $150,103.31 | $197,025.33 | $254,232.70 | 244.4% |
| Month | Minimum Price | Average Price | Maximum Price | Potential ROI |
|---|---|---|---|---|
| January | $151,677.59 | $172,496.45 | $209,710.49 | 184.1% |
| February | $149,802.70 | $171,406.94 | $209,183.39 | 183.4% |
| March | $147,927.80 | $170,317.43 | $208,656.29 | 182.7% |
| April | $146,052.90 | $169,227.92 | $208,129.19 | 182% |
| May | $144,178.01 | $168,138.41 | $207,602.10 | 181.3% |
| June | $142,303.11 | $167,048.90 | $207,075 | 180.5% |
| July | $140,428.21 | $165,959.39 | $206,547.90 | 179.8% |
| August | $138,553.32 | $164,869.89 | $206,020.80 | 179.1% |
| September | $136,678.42 | $163,780.38 | $205,493.71 | 178.4% |
| October | $134,803.53 | $162,690.87 | $204,966.61 | 177.7% |
| November | $132,928.63 | $161,601.36 | $204,439.51 | 177% |
| December | $131,053.73 | $160,511.85 | $203,912.41 | 176.3% |
| All Time | $141,365.66 | $166,504.15 | $206,811.45 | 180.2% |
In the next year, aka 2025, Bitcoin price is likely to stay well above the six-digit territory and shows no signs of correction below it. Coingape’s Bitcoin price prediction data reveals a peak of $104,280.26 in February 2025.
| Month | Minimum Price | Average Price | Maximum Price | Potential ROI |
|---|---|---|---|---|
| January | $136,338.75 | $171,296.56 | $222,914.36 | 202% |
| February | $141,623.77 | $182,081.27 | $241,916.31 | 227.7% |
| March | $146,908.79 | $192,865.98 | $260,918.26 | 253.5% |
| April | $152,193.80 | $203,650.69 | $279,920.21 | 279.2% |
| May | $157,478.82 | $214,435.40 | $298,922.16 | 305% |
| June | $162,763.84 | $225,220.10 | $317,924.11 | 330.7% |
| July | $168,048.86 | $236,004.81 | $336,926.06 | 356.5% |
| August | $173,333.87 | $246,789.52 | $355,928.01 | 382.2% |
| September | $178,618.89 | $257,574.23 | $374,929.96 | 407.9% |
| October | $183,903.91 | $268,358.94 | $393,931.91 | 433.7% |
| November | $189,188.93 | $279,143.65 | $412,933.86 | 459.4% |
| December | $194,473.94 | $289,928.36 | $431,935.81 | 485.2% |
| All Time | $165,406.35 | $230,612.46 | $327,425.08 | 343.6% |
| Month | Minimum Price | Average Price | Maximum Price | Potential ROI |
|---|---|---|---|---|
| January | $200,517.73 | $296,410.39 | $434,187.74 | 488.2% |
| February | $206,561.52 | $302,892.41 | $436,439.67 | 491.3% |
| March | $212,605.30 | $309,374.44 | $438,691.61 | 494.3% |
| April | $218,649.09 | $315,856.47 | $440,943.54 | 497.4% |
| May | $224,692.88 | $322,338.50 | $443,195.47 | 500.4% |
| June | $230,736.66 | $328,820.53 | $445,447.40 | 503.5% |
| July | $236,780.45 | $335,302.55 | $447,699.34 | 506.5% |
| August | $242,824.23 | $341,784.58 | $449,951.27 | 509.6% |
| September | $248,868.02 | $348,266.61 | $452,203.20 | 512.6% |
| October | $254,911.81 | $354,748.64 | $454,455.13 | 515.7% |
| November | $260,955.59 | $361,230.67 | $456,707.07 | 518.7% |
| December | $266,999.38 | $367,712.69 | $458,959 | 521.8% |
| All Time | $233,758.55 | $332,061.54 | $446,573.37 | 505% |
| Month | Minimum Price | Average Price | Maximum Price | Potential ROI |
|---|---|---|---|---|
| January | $261,462.86 | $358,555.52 | $448,457.64 | 507.6% |
| February | $255,926.34 | $349,398.34 | $437,956.29 | 493.3% |
| March | $250,389.82 | $340,241.16 | $427,454.93 | 479.1% |
| April | $244,853.29 | $331,083.98 | $416,953.58 | 464.9% |
| May | $239,316.77 | $321,926.81 | $406,452.22 | 450.6% |
| June | $233,780.25 | $312,769.63 | $395,950.87 | 436.4% |
| July | $228,243.73 | $303,612.45 | $385,449.51 | 422.2% |
| August | $222,707.21 | $294,455.27 | $374,948.16 | 408% |
| September | $217,170.69 | $285,298.10 | $364,446.80 | 393.7% |
| October | $211,634.16 | $276,140.92 | $353,945.45 | 379.5% |
| November | $206,097.64 | $266,983.74 | $343,444.09 | 365.3% |
| December | $200,561.12 | $257,826.56 | $332,942.74 | 351.1% |
| All Time | $231,011.99 | $308,191.04 | $390,700.19 | 429.3% |
| Month | Minimum Price | Average Price | Maximum Price | Potential ROI |
|---|---|---|---|---|
| January | $200,289.78 | $255,591.44 | $330,717.70 | 348% |
| February | $200,018.43 | $253,356.31 | $328,492.66 | 345% |
| March | $199,747.09 | $251,121.19 | $326,267.62 | 342% |
| April | $199,475.75 | $248,886.06 | $324,042.58 | 339% |
| May | $199,204.40 | $246,650.94 | $321,817.54 | 336% |
| June | $198,933.06 | $244,415.81 | $319,592.50 | 333% |
| July | $198,661.72 | $242,180.69 | $317,367.46 | 330% |
| August | $198,390.37 | $239,945.56 | $315,142.42 | 326.9% |
| September | $198,119.03 | $237,710.44 | $312,917.38 | 323.9% |
| October | $197,847.69 | $235,475.31 | $310,692.34 | 320.9% |
| November | $197,576.34 | $233,240.19 | $308,467.30 | 317.9% |
| December | $197,305 | $231,005.06 | $306,242.27 | 314.9% |
| All Time | $198,797.39 | $243,298.25 | $318,479.98 | 331.5% |
| Month | Minimum Price | Average Price | Maximum Price | Potential ROI |
|---|---|---|---|---|
| January | $230,107.34 | $272,618.52 | $379,679.91 | 414.4% |
| February | $262,909.68 | $314,231.98 | $453,117.55 | 513.9% |
| March | $295,712.03 | $355,845.44 | $526,555.20 | 613.4% |
| April | $328,514.37 | $397,458.90 | $599,992.84 | 712.8% |
| May | $361,316.71 | $439,072.36 | $673,430.49 | 812.3% |
| June | $394,119.05 | $480,685.82 | $746,868.13 | 911.8% |
| July | $426,921.39 | $522,299.28 | $820,305.78 | 1011.3% |
| August | $459,723.73 | $563,912.74 | $893,743.42 | 1110.8% |
| September | $492,526.08 | $605,526.20 | $967,181.07 | 1210.3% |
| October | $525,328.42 | $647,139.66 | $1,040,618.71 | 1309.8% |
| November | $558,130.76 | $688,753.11 | $1,114,056.36 | 1409.3% |
| December | $590,933.10 | $730,366.57 | $1,187,494 | 1508.8% |
| All Time | $410,520.22 | $501,492.55 | $783,586.95 | 961.6% |
| Month | Minimum Price | Average Price | Maximum Price | Potential ROI |
|---|---|---|---|---|
| January | $651,759.93 | $815,927.70 | $1,317,973.10 | 1685.5% |
| February | $712,586.75 | $901,488.83 | $1,448,452.20 | 1862.3% |
| March | $773,413.58 | $987,049.96 | $1,578,931.29 | 2039.1% |
| April | $834,240.40 | $1,072,611.09 | $1,709,410.39 | 2215.8% |
| May | $895,067.23 | $1,158,172.22 | $1,839,889.49 | 2392.6% |
| June | $955,894.05 | $1,243,733.35 | $1,970,368.59 | 2569.4% |
| July | $1,016,720.88 | $1,329,294.48 | $2,100,847.68 | 2746.1% |
| August | $1,077,547.70 | $1,414,855.61 | $2,231,326.78 | 2922.9% |
| September | $1,138,374.53 | $1,500,416.74 | $2,361,805.88 | 3099.7% |
| October | $1,199,201.35 | $1,585,977.87 | $2,492,284.98 | 3276.4% |
| November | $1,260,028.18 | $1,671,539 | $2,622,764.08 | 3453.2% |
| December | $1,320,855 | $1,757,100.13 | $2,753,243.17 | 3630% |
| All Time | $986,307.46 | $1,286,513.92 | $2,035,608.14 | 2657.8% |
Roughly five years from now, aka 2030, Bitcoin’s price will see an explosion to the upside, with an all-time high of $774,474 in the aforementioned year. In the same period, BTC could reach a low of $465,154.42. Based on CoinGape predictions, the average price of BTC in 2050 is between $2.9 million and $3.3 million.
Investors should note that these long-term predictions can change and, hence, should be taken with a grain of salt.
After crashing 4% on December 10, Bitcoin formed a local bottom at $94,190. This move was followed by an 8.25% rally which increased BTC’s value by $7,770 to $101,961. The sudden uptrend comes after two liquidation events that wiped on positions worth $1.5 billion and $1.7 billion on December 5 and 9, respectively.
During bull runs, these flash crashes are normal and are net bullish for the crypto ecosystem as they reset the high leverage present in the system, allowing markets to climb much higher. As a result of the liquidation event, prices often recover in an impulsive move, suggesting that the trend is back on track.
On the one-hour chart, Bitcoin trades above the Value Area High (VAH) of $99,690. Going forward, investors can expect a minor retracement that retests the VAH. If the uptrend is true, BTC bulls need to defend this key barrier. A bounce here could set the stage for the next leg up.
Under these circumstances, a bounce from $99,690 could send Bitcoin price up by 5.10% to revisit the ATH of $104,698.
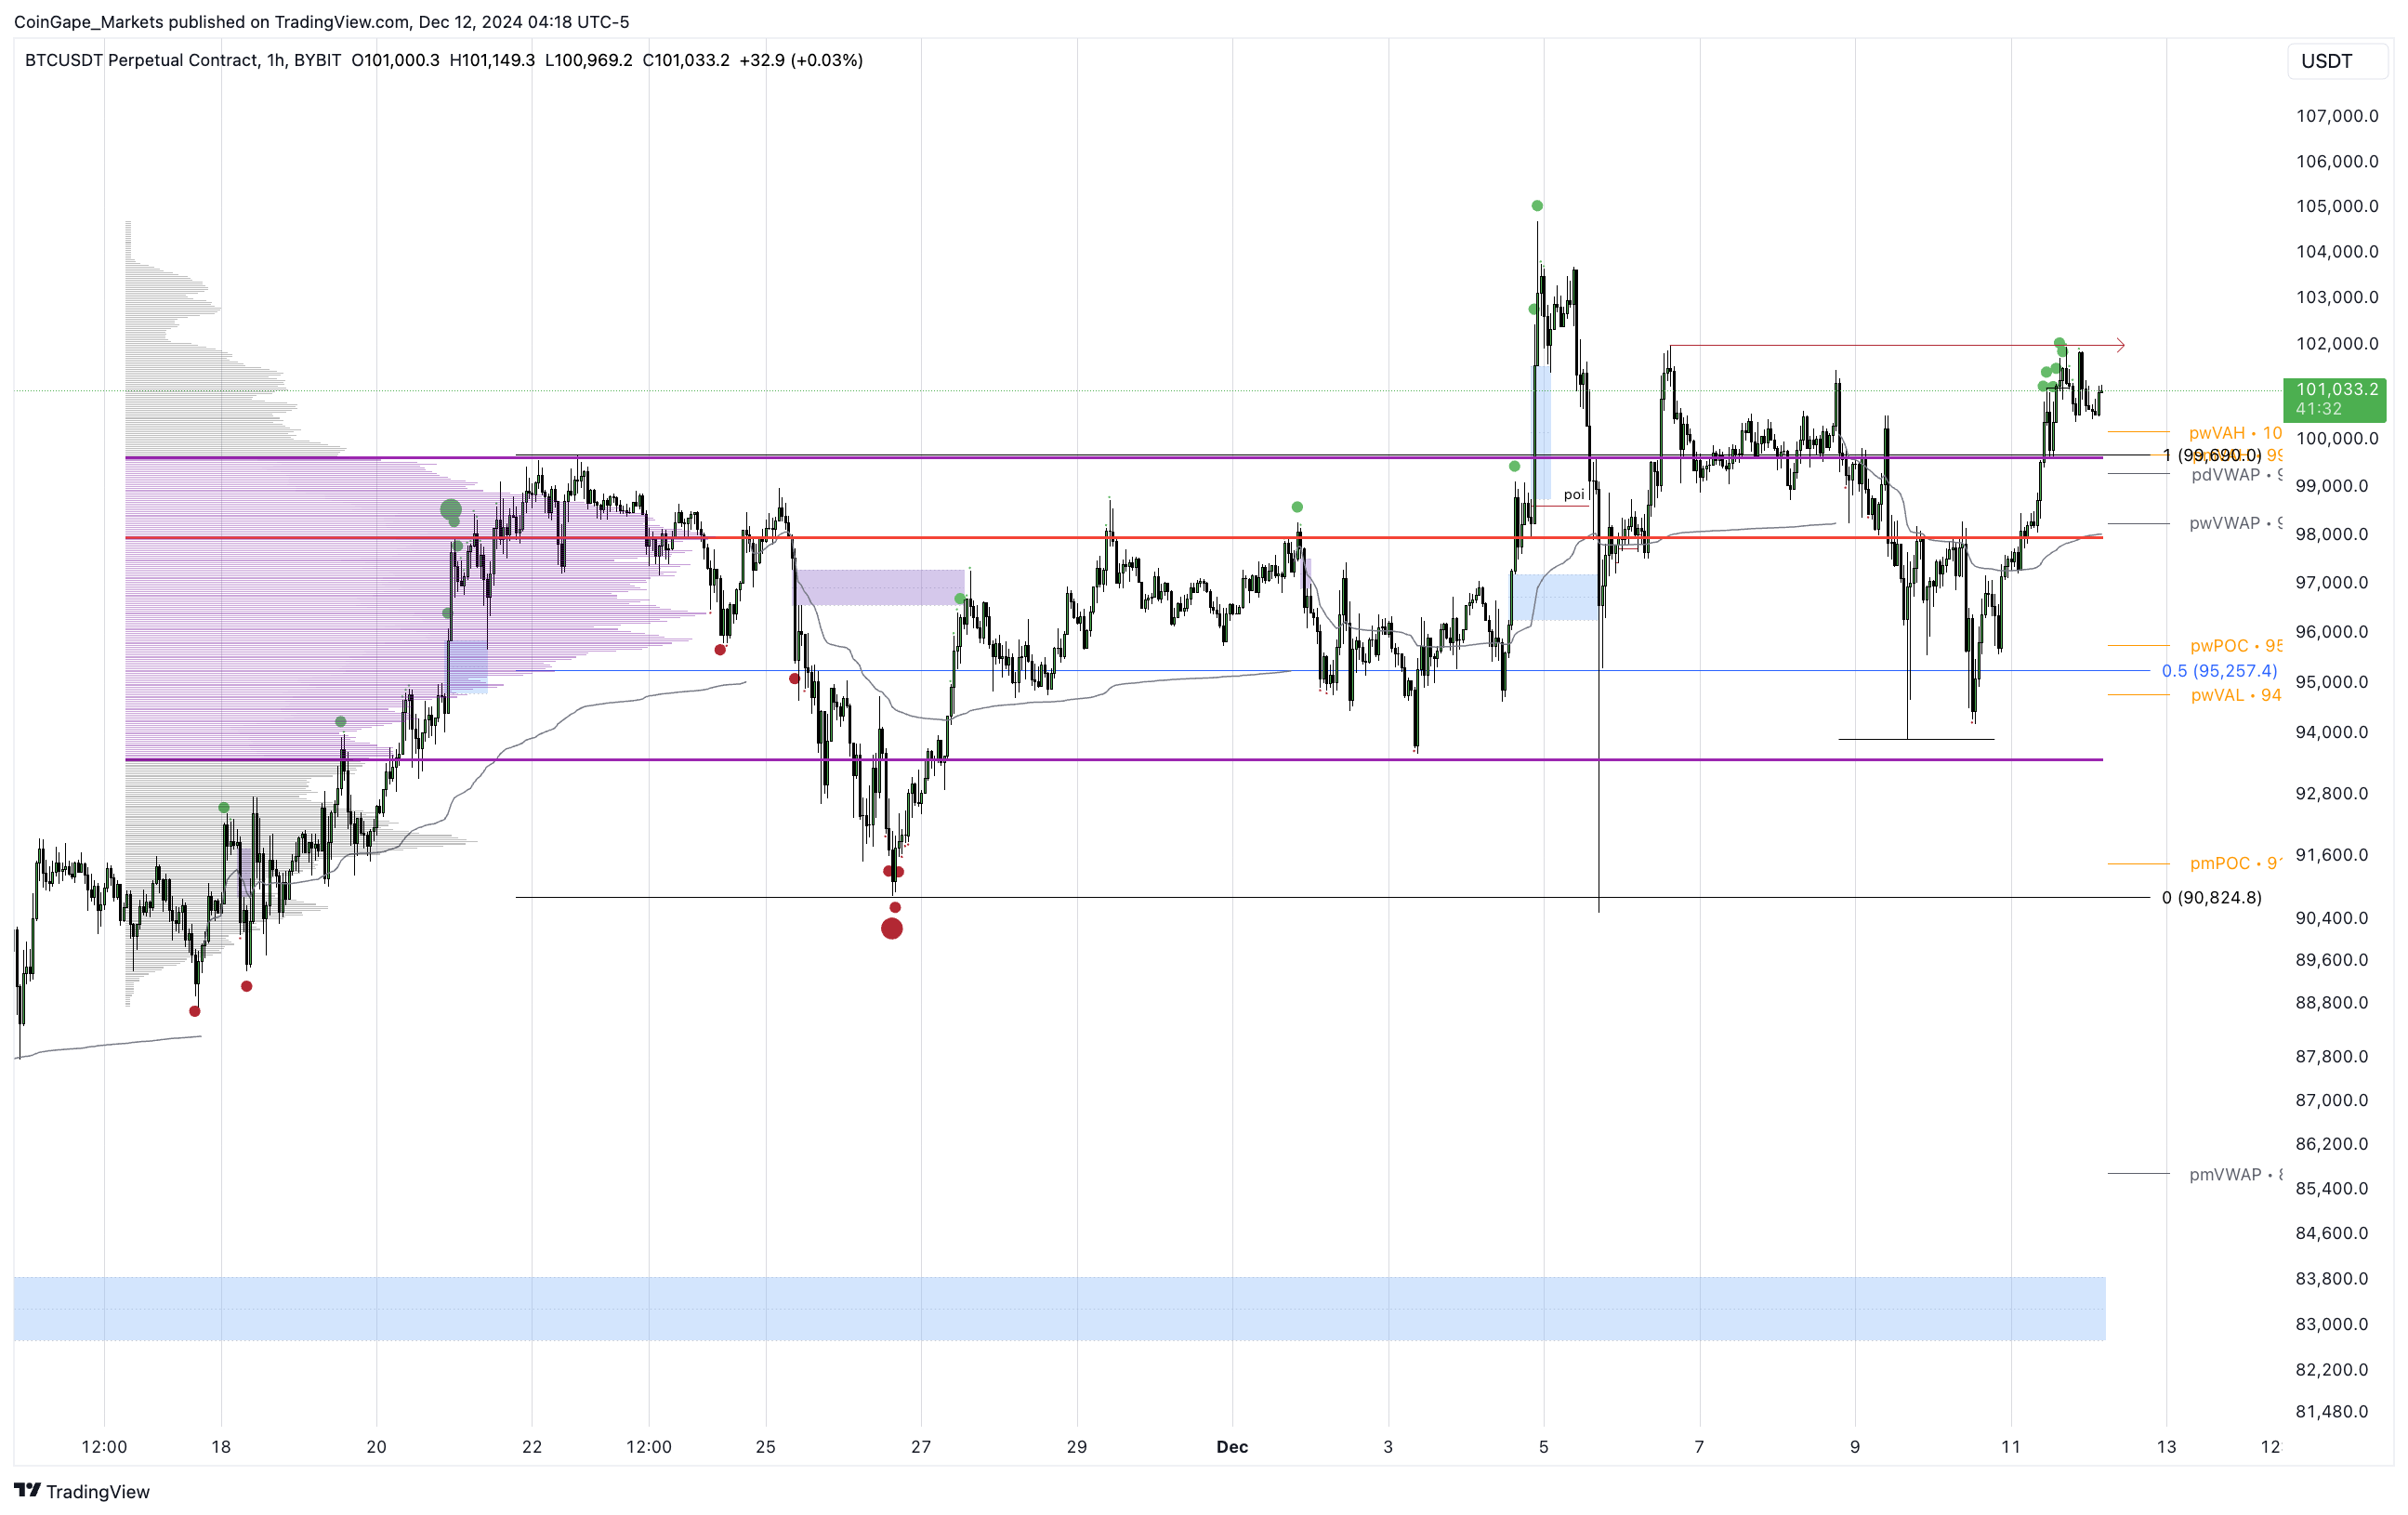
On the other hand, if the breakout has a lack of interested buyers, Bitcoin price would breach $99,690. Such a development could see BTC reenter the volume profile’s range that extends from $93,509 to $99,690. This indicator shows that profile of the volume traded between November 11 and today. The VAH and VAL are high and low value areas. The red line is known as the Point of Control (POC), which is where the highest volume was traded. A breakdown of $99,690 could see BTC revisit the POC at $98,000.
CoinGape prepared a review methodology to rate crypto exchanges, tools, and apps. We curated a list of metrics to evaluate crypto platforms based on their services, user experience, security and customer support, payment gateways and charges, pricing and promotions. Visit our Review Methodology page to learn more about how we review each crypto platform.
This content is purely for educational purposes and should not be considered as financial advice. Do your own research before investing in any crypto platform and only invest the amount you can afford to lose.


 50k+ Articles


