Bitcoin ETF Records 4-Day Streak As BlackRock Boosts With $82M Influx


Highlights
- Bitcoin price slipped below the $60K mark again today, indicating the ongoing volatility in the market.
- US Spot Bitcoin ETF recorded inflow for four straight day, fueling market confidence.
- BlackRock's IBIT recorded influx for the first time since June 20.
The Bitcoin price has once again dropped today, falling below the $60,000 mark, while the U.S. Spot Bitcoin ETFs noted a positive momentum for the fourth straight day. Notably, several market analysts have attributed the recent sluggish trading of the U.S. Spot Bitcoin ETF as a key reason behind the BTC price dip.
However, with the U.S. Bitcoin ETF staying in the green this week, it appears that there are certain other factors in play.
US Spot Bitcoin ETF Recorded Inflows For Four Days
Bitcoin has faced a downturn, slipping below the $60,000 mark, attributed to tepid trading in U.S. Spot Bitcoin ETFs. However, despite this price dip, the ETFs have seen positive momentum for four consecutive days, indicating a complex interplay of market forces. The recent influx is notably driven by significant contributions from BlackRock’s IBIT.
According to data from Farside Investors, the overall U.S. Spot Bitcoin ETF sector recorded a $73 million influx. BlackRock, a major player, recorded its first significant influx since June 20, with a substantial $82.4 million injected into its IBIT ETF. Notably, this influx stands out against the backdrop of outflows from other major Bitcoin ETFs.
For context, GrayScale’s GBTC and Fidelity’s FBTC, traditionally strong performers in the Bitcoin ETF market, reported outflows of $27.2 million and $25 million, respectively. Yet, the outflows were counterbalanced by BlackRock’s substantial influx and additional contributions from Ark 21Shares’s ARKB, which saw a $42.8 million influx.

Meanwhile, this redistribution of capital suggests a strategic shift among investors, favoring ETFs showing resilience and potential for growth. Besides, the recent inflows reflect growing investor confidence in Bitcoin ETFs, despite the overall market’s mixed performance.
Also Read: Coinbase, MicroStrategy, and Crypto Stocks Record Weekly Upswing
Weekly Trends Signal Mixed Sentiment
The week has been turbulent for Bitcoin ETFs, marked by a significant outflux of $174.5 million on June 24. This substantial outflow set a challenging tone for the week.
Notably, the following four days saw a total influx of $137.2 million, culminating in a net outflux of $37.3 million for the week. These figures highlight a volatile yet optimistic market landscape.
Meanwhile, the positive streak over the past four days suggests a potential recovery and resilience in the Bitcoin ETF sector, driven by targeted investments and strategic capital reallocations. Besides, the contrast between the initial outflux and the subsequent inflows points to a market responsive to changing dynamics, with investors adapting quickly to emerging opportunities.
As Bitcoin’s price fluctuates, the performance of its ETFs offers a critical barometer for investor sentiment and market health. As of writing, Bitcoin price was down nearly 1.5% and exchanged hands at $60,668. Over the last 24 hours, the crypto has touched a high of $61,720.31, with CoinGlass data showing that BTC Futures Open Interest falling over 2% to $31.62 billion in the same timeframe.
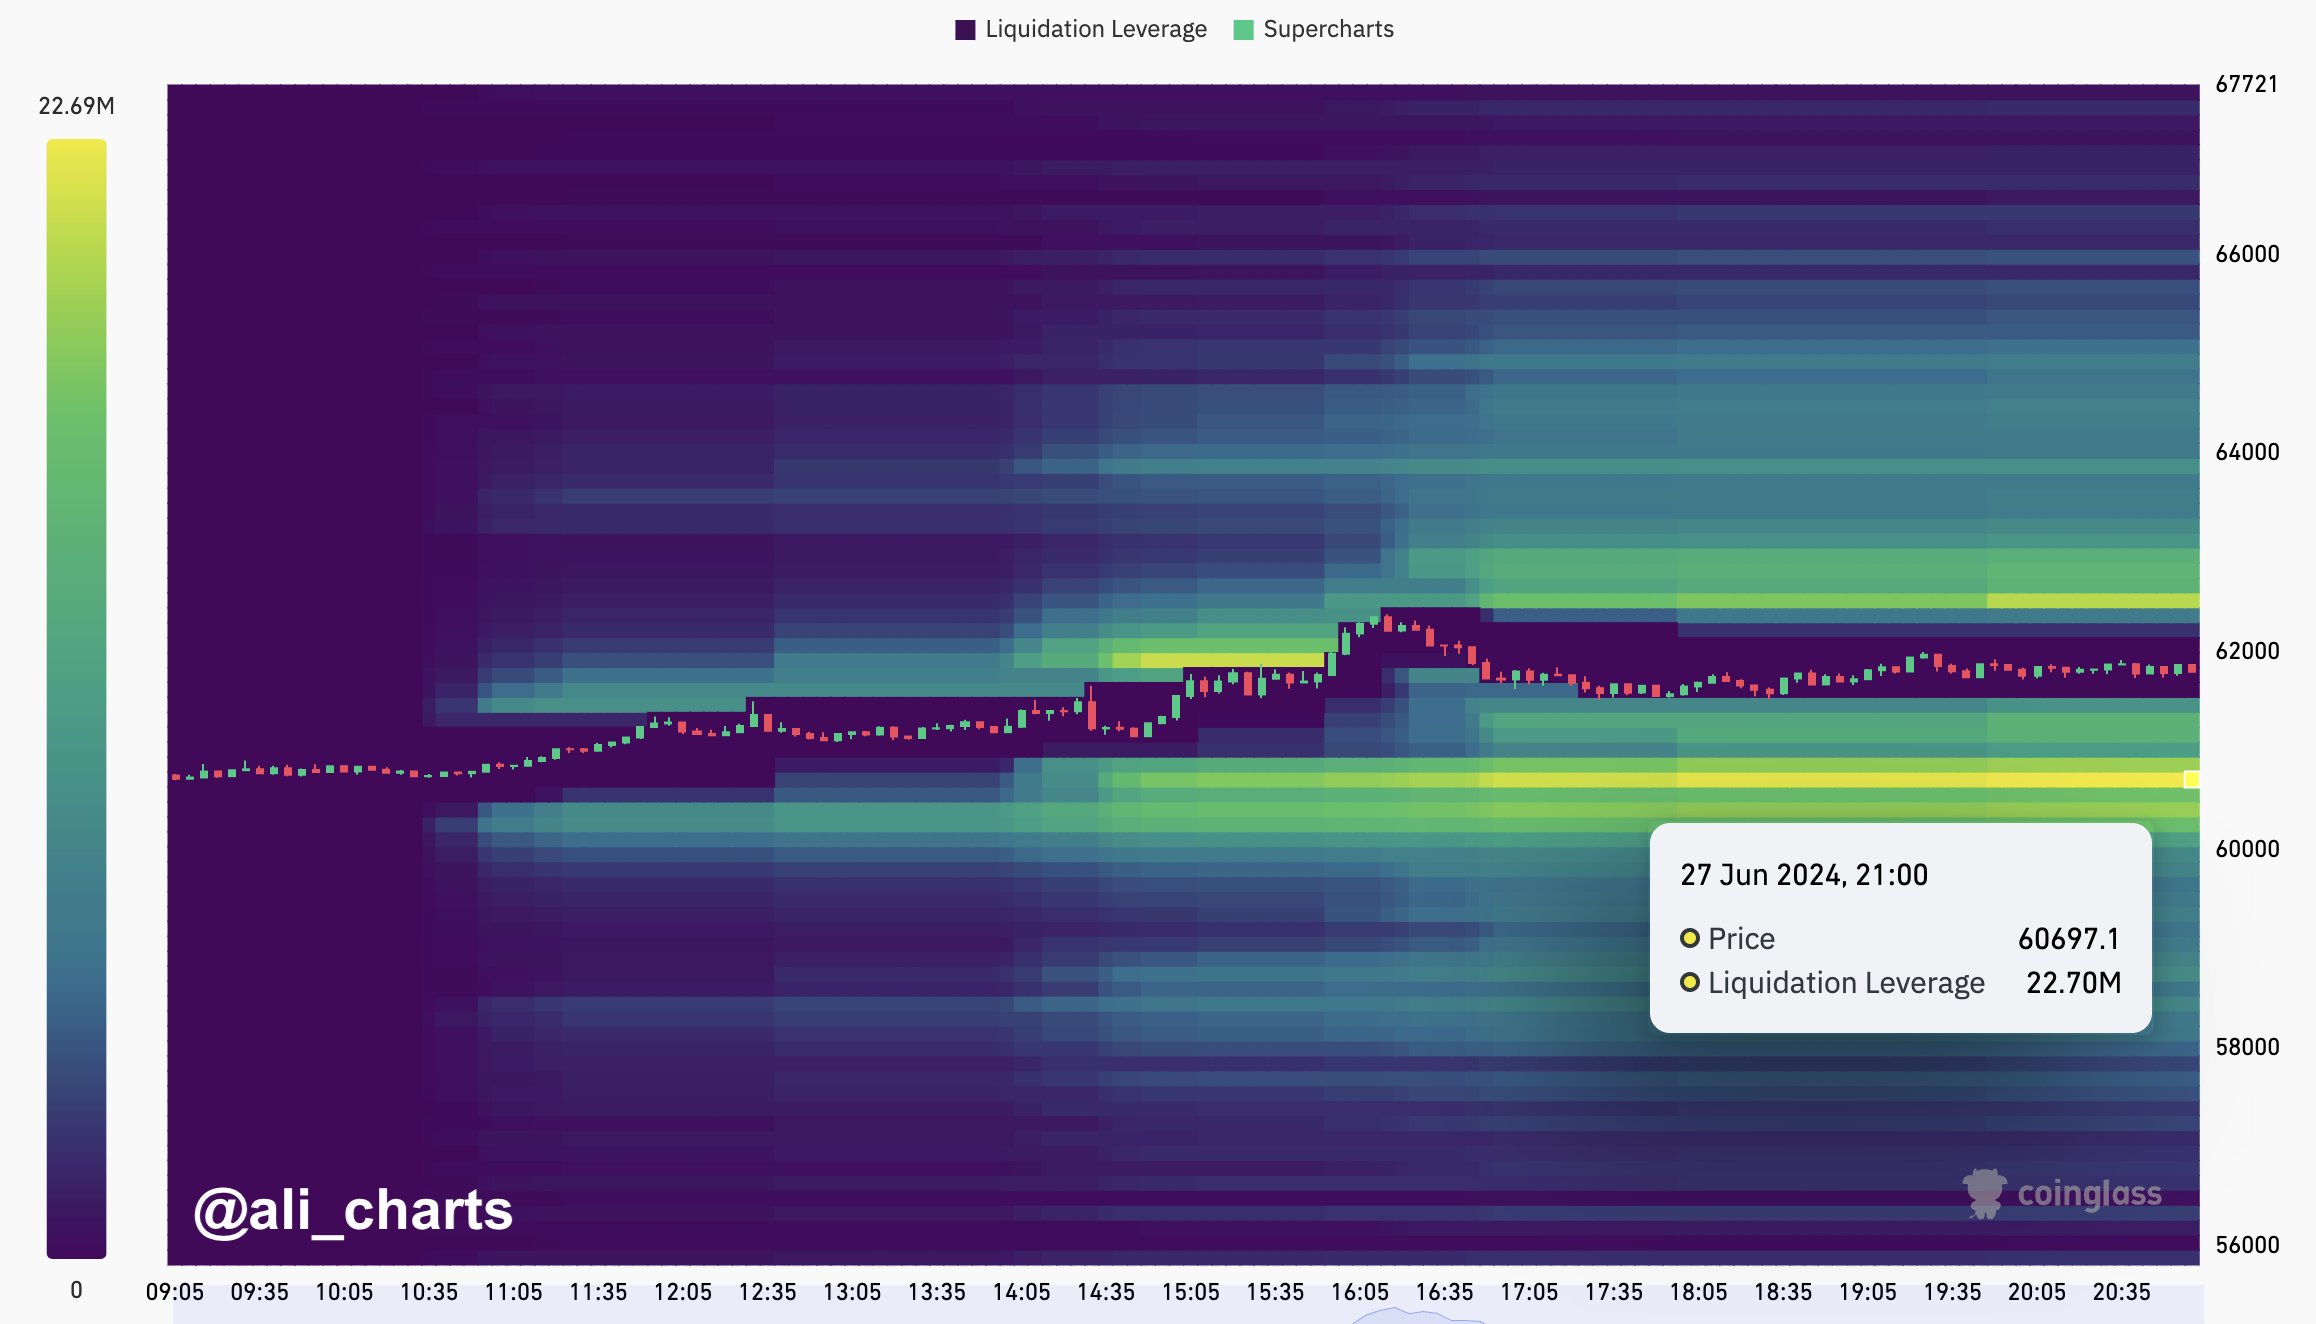
Notably, the market is now keeping a close track of the BTC price movements with analysts warning of a significant liquidation. For context, popular crypto market analyst Ali Martinez warned of over $22 million liquidation if Bitcoin drops to the $60,700 level.
Also Read: Could Solana Mimic Ethereum and Surge to $1,000? Analysts Weigh In
Why Trust CoinGape
CoinGape has covered the cryptocurrency industry since 2017, aiming to provide informative insights Read more… to our readers. Our journal analysts bring years of experience in market analysis and blockchain technology to ensure factual accuracy and balanced reporting. By following our Editorial Policy, our writers verify every source, fact-check each story, rely on reputable sources, and attribute quotes and media correctly. We also follow a rigorous Review Methodology when evaluating exchanges and tools. From emerging blockchain projects and coin launches to industry events and technical developments, we cover all facets of the digital asset space with unwavering commitment to timely, relevant information.


Delivered every day.
- Insights that move markets
- 100,000 active subscribers