Bitcoin Price Analysis: BTC Bulls Put Up A Ferociously Fight, Avoiding Further Losses


- Bitcoin briefly slipped under $48,000, but bulls reacted immediately, pulling the price higher.
- The transaction history model reveals that BTC sits on robust support areas, crediting the recovery.
- The MACD has a minor bearish impulse that may keep bulls from accomplishing their goals above $50,000 in the near term.
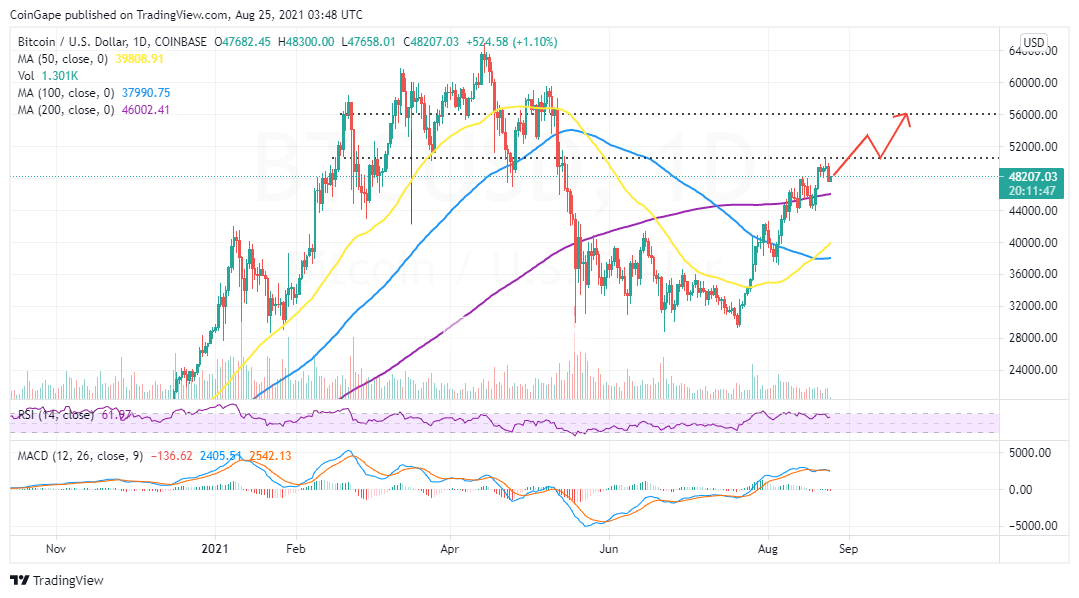
Bitcoin price eventually slipped under $50,000 following the liftoff to $50,647 on Monday. The flagship cryptocurrency lost steam despite bulls having $56,000 in sight.
The correction initially found refuge slightly above $49,000, but bearish pressure continued to intensify during the Asian session on Wednesday. After testing the area at $47,517, Bitcoin regained ground above $48,000 and is currently exchanging hands at $48,230.
Bitcoin Price Battles To Nurture The Uptrend
The flagship cryptocurrency is trading above all the key moving averages on the daily chart, the 50 SMA, the 100 SMA, and the 200 SMA. This suggests that BTC’s slightest resistance path is on the upside.
Nonetheless, the immediate support at $48,000 must remain intact to allow bulls to execute the return mission above $50,000. Realize that the 50 SMA recently crossed above the 200 SMA, adding props to the uptrend despite the lock-step price action.
Perhaps a break above $50,000 and, for that matter, past the recently traded August high at $50,647 would pave the way for another trajectory to $56,000. Note that whales have kept stocking up on Bitcoin amid speculation that it could extend the bull cycle to $100,000 by the end of 2021.
BTC/USD Daily Chart
In the meantime, Bitcoin is trading above vital support areas, as highlighted by the IOMAP model developed by IntoTheBlock. This on-chain model reveals that the area at $46,012 is a massive buyer congestion zone. Roughly 922,500 addresses bought 490,400 BTC and are currently profiting from the bellwether cryptocurrency.
Bitcoin IOMAP Chart
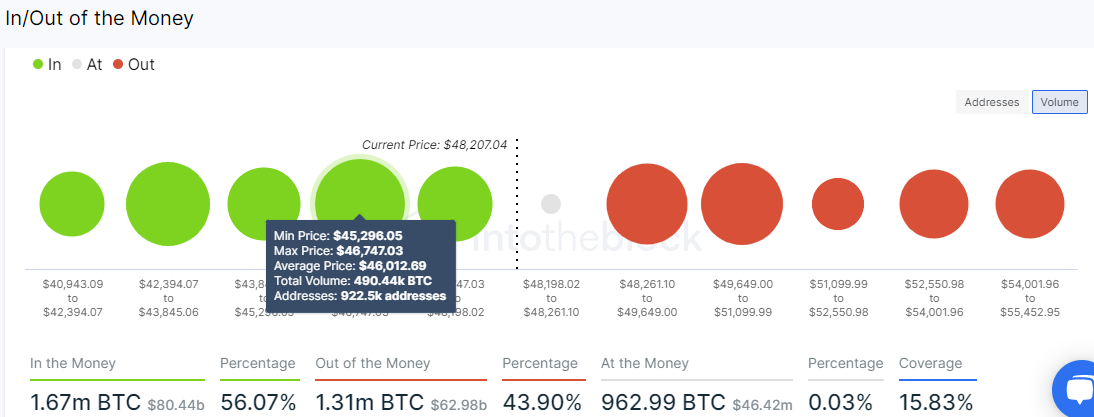
On the upside, the barriers ahead of Bitcoin are relatively smaller, suggesting that bulls would achieve their goals with a slight push. However, the region at $50,031 is of interest and must be shattered to give way to the expected gains to $56,000. Here, 672,000 addresses previously purchased 375,300 BTC.
Bitcoin Intraday Levels
Spot rate: 48,230
Trend: Bullish
Volatility: Low
Support: The 200-day SMA and $56,000
Resistance: $50,000 and $52,000

Why Trust CoinGape
CoinGape has covered the cryptocurrency industry since 2017, aiming to provide informative insights Read more… to our readers. Our journal analysts bring years of experience in market analysis and blockchain technology to ensure factual accuracy and balanced reporting. By following our Editorial Policy, our writers verify every source, fact-check each story, rely on reputable sources, and attribute quotes and media correctly. We also follow a rigorous Review Methodology when evaluating exchanges and tools. From emerging blockchain projects and coin launches to industry events and technical developments, we cover all facets of the digital asset space with unwavering commitment to timely, relevant information.

Delivered every day.
- Insights that move markets
- 100,000 active subscribers
Related Articles


- Bitcoin vs Gold Feb 2026: Which Asset Could Spike Next?
- Top 3 Reasons Why Crypto Market is Down Today (Feb. 22)
- Michael Saylor Hints at Another Strategy BTC Buy as Bitcoin Drops Below $68K
- Expert Says Bitcoin Now in ‘Stage 4’ Bear Market Phase, Warns BTC May Hit 35K to 45K Zone
- Bitcoin Price Today As Bulls Defend $65K–$66K Zone Amid Geopolitics and Tariffs Tensions
- COIN Stock Price Prediction: Will Coinbase Crash or Rally in Feb 2026?
- Shiba Inu Price Feb 2026: Will SHIB Rise Soon?
- Pi Network Price Prediction: How High Can Pi Coin Go?
- Dogecoin Price Prediction Feb 2026: Will DOGE Break $0.20 This month?
- XRP Price Prediction As SBI Introduces Tokenized Bonds With Crypto Rewards
- Ethereum Price Rises After SCOTUS Ruling: Here’s Why a Drop to $1,500 is Possible


