 Buy $GGs
Bitcoin Price Analysis: BTC Continues To Struggle At $7,000 – When Will We Break Above Here?


- Bitcoin fell by a total of 1.30% today as it currently trades at $6,789.
- The cryptocurrency managed to poke itself above the upper boundary of the consolidation pattern but failed to close anywhere near the crucial $7,000 level.
Bitcoin managed to break above the upper boundary of the ascending triangle that we have been following but only ever so slightly. Moreover, the cryptocurrency failed to close anywhere near the crucial $7,000 level as it rolled over and dropped back into the triangle today.
This slight breakout above the triangle could easily be a false breakout signal as the volume is very low which resulted in Bitcoin dropping back into the consolidation today as it falls back beneath $6,800.
Bitcoin Price Analysis
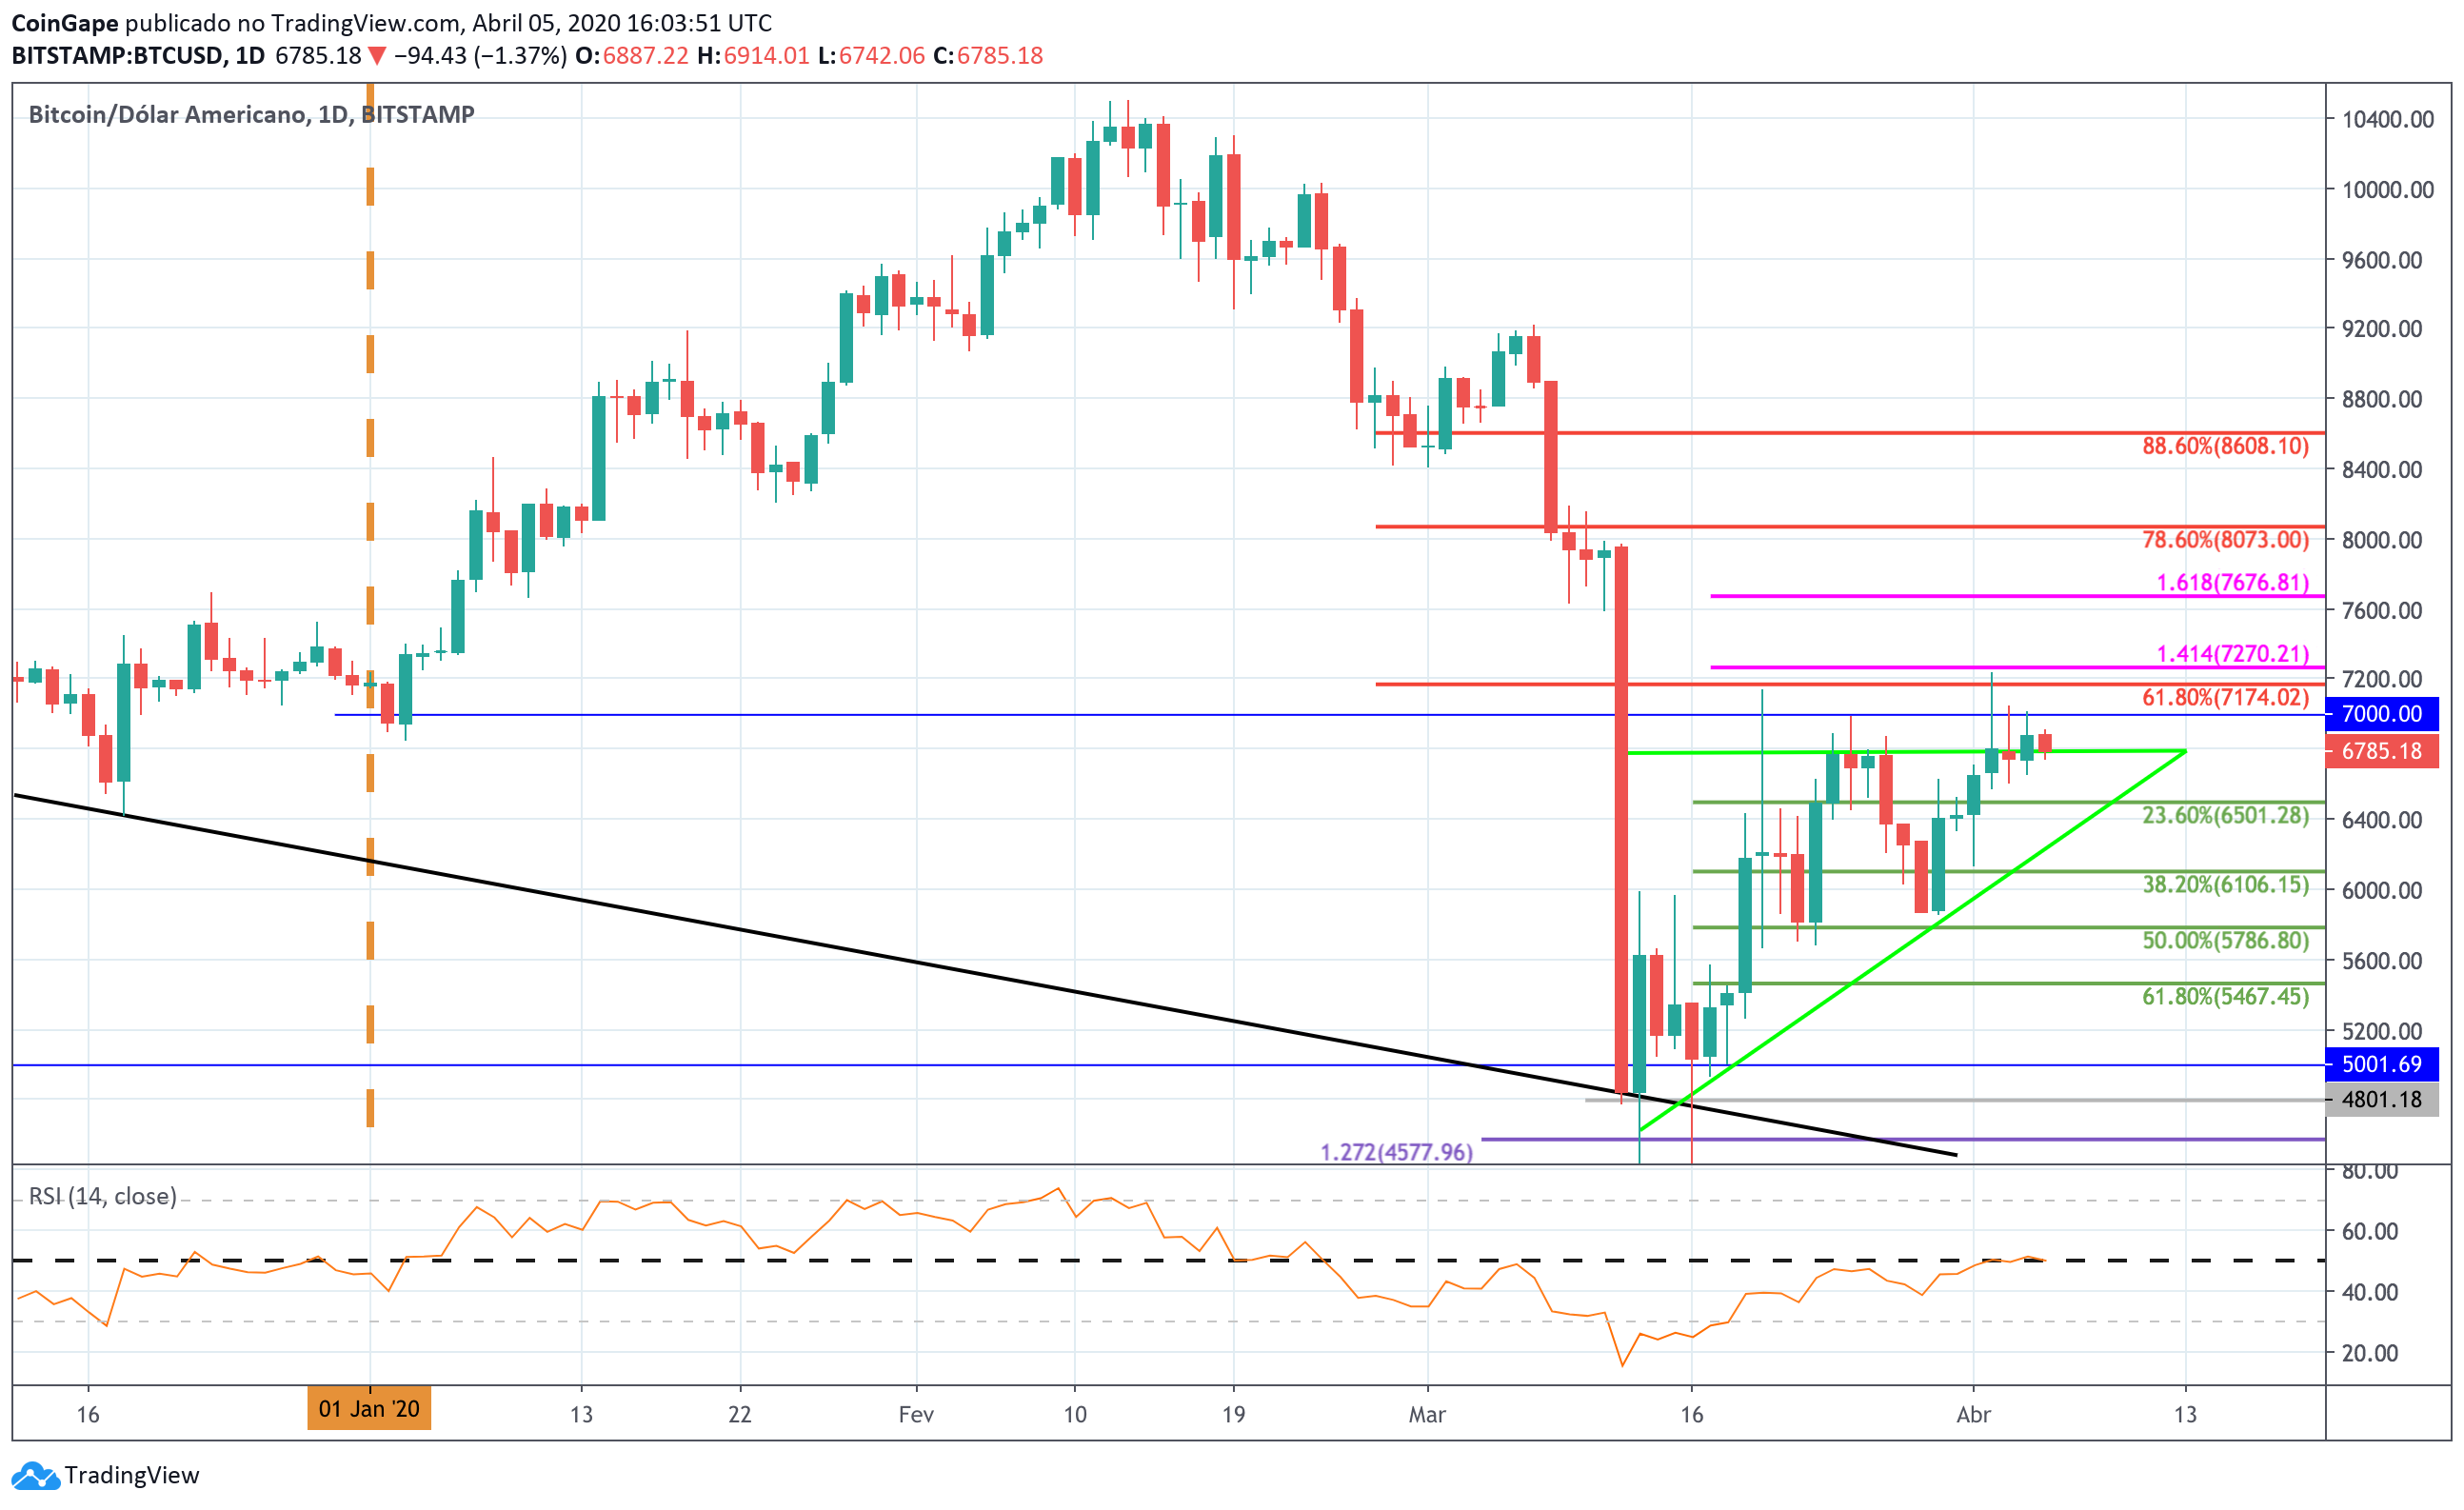
BTC/USD – Daily CHART – SHORT TERM
Market Overview
Analyzing the daily chart above, we can clearly see the clean break above the triangle as Bitcoin managed to close above $6,800 yesterday. However, it still failed to close above the $7,000 level which could actually be the real boundary of the triangle itself.
The cryptocurrency has since rolled over today and dropped back into the triangle as we wait for today’s closing candle to provide further suggestions about where we may be headed next.
Short term prediction: NEUTRAL
Bitcoin still remains neutral whilst it trades within the confines of the triangle.
The first level of support beneath $6,700 is located at $6,500 which is provided by the short term .236 Fib Retracement level. Beneath this, support lies at the rising trend line and $6,100 (.382 Fib Retracement). This is followed by support at $6,000 and $5,786.
Toward the upside, resistance lies at $6,800 and $7,000. Above this, resistance lies at $7,174 (bearish .618 Fib Retracement), $7,270 (1.414 Fib Extension), $7,500, and $7,676 (1.618 Fib Extension).
Key Levels
Support: $6,500, $6,100, $6,000, $5,911, $5,786, $5,636, $5,600, $5,500, $5,467 $5,200, $5,000, $4,800, $4,672, $4,577, $4,139, $4,000, $3,912, $3,500, $3,436.
Resistance: $6,800, $7,000, $7,174, $7,200, $7,270, $7,500, $7,676, $8,000, $8,073, $8,250, $8,461, $8,672, $8,979, $9,000, $9,100.
Play 10,000+ Casino Games at BC Game with Ease
- Instant Deposits And Withdrawals
- Crypto Casino And Sports Betting
- Exclusive Bonuses And Rewards


Why Trust CoinGape
CoinGape has covered the cryptocurrency industry since 2017, aiming to provide informative insights Read more… to our readers. Our journal analysts bring years of experience in market analysis and blockchain technology to ensure factual accuracy and balanced reporting. By following our Editorial Policy, our writers verify every source, fact-check each story, rely on reputable sources, and attribute quotes and media correctly. We also follow a rigorous Review Methodology when evaluating exchanges and tools. From emerging blockchain projects and coin launches to industry events and technical developments, we cover all facets of the digital asset space with unwavering commitment to timely, relevant information.

Delivered every day.
- Insights that move markets
- 100,000 active subscribers
Related Articles


- Indiana Signs Bitcoin Bill Into Law Allowing Crypto in Retirement Plans
- ‘Time to Act Is Now’: CFTC Chief Pushes Swift Passage of CLARITY Act
- Trump Tells Congress to Pass Crypto Market Bill ‘ASAP,’ Blasts Banks for Stalling
- BTC Price Bounces as Spot Investors Buy The Dip Amid Iran War Jitters
- CFTC Chief Mike Selig Signals US Crypto Perpetual Futures Rollout in Coming Weeks
- Gold Price Prediction March 2026: Rally, Crash, or Record Highs?
- RIOT Stock Prediction as Needham, Piper Sandler Slash Target After Earnings
- Cardano Price Outlook As Charles Hoskinson Warns Over CLARITY Act
- Circle Stock Price Climbs 15% to $96, Can Rally Continue in March 2026?
- Bitcoin Price Prediction as US-Iran War Enters 4th Consecutive Day
- Top 5 Historical Reasons Dogecoin Price Is Not Rising


