 Buy $GGs
Bitcoin Price Analysis: Is The Worst Yet To Come? BTC/USD Double-Top Pattern Spotted


- Bitcoin price soared from last week’s lows at $8,100 but once again got rejected at the critical $10,000.
- Bitcoin is staring into a bottomless pit id it does not break the hurdle at $10,000; possible double-top reversal.
Bitcoin made a run for the $10,000 level on Thursday. The bullish momentum was so impressive that investors waited with bated breath to see a confirmed breakout above $10,000. When Bitcoin climbed above $10,000 last week, it lost steam slightly above $10,100. The growth from recent lows at $8,100 confirmed to the buyers that $10,000 was achievable and could allow them to shift their focus on higher levels at $13,800 (2019 high) and $20,000 (all-time high).
However, Bitcoin bears had a different plan, which they seem to be succeeding as BTC/USD hit a wall at $9,935 (on Coinbase). Following the snag, Bitcoin embarked on gains slashing exercise to the extent of touching $9,234 (intraday low). At the time of writing, Bitcoin has adjusted upwards to $9,490(market value). The real struggle is to hold above $9,500; a move that would give buyers a chance to focus on breaking the critical level at $10,000.
Double-top Pattern Reversal In The Offing
As Bitcoin inched closer to $10,000 it hinted the possibility of a double-top pattern could come into the picture. This pattern is usually used in technical analysis to signal a possible reversal from a continued uptrend. In this case, if Bitcoin retests $10,000 or even better $10,100 and fails to sustain gains to higher levels based on good volume, a reversal from this pattern could sink Bitcoin to levels seen last week close to $10,000.
BTC/USD 1-hour chart
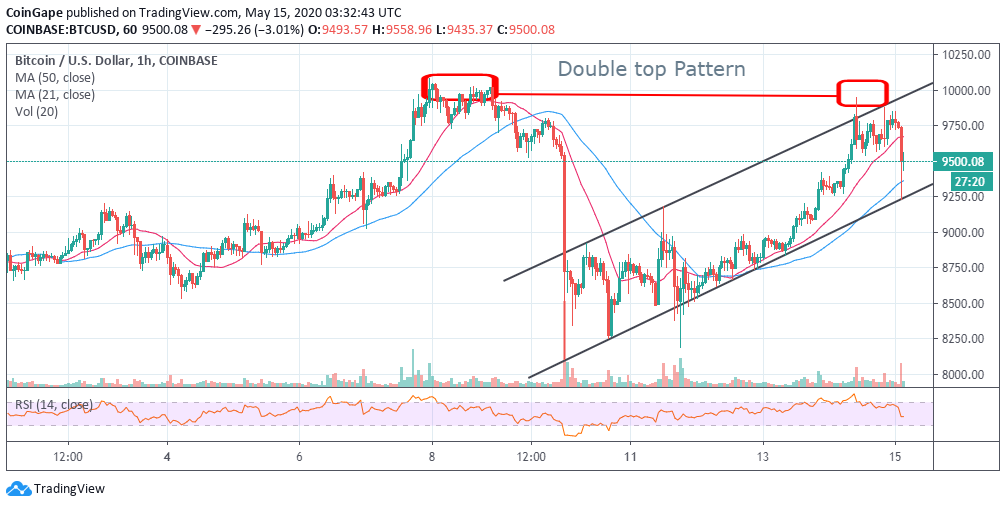
Consequently, the RSI shows that Bitcoin is in for a bearish beating as it slides under the average (50). On the brighter side, the widening gap between the 21 EMA and the 50 EMA suggests that buying pressure is still present only that it lacks a catalyst.
Bitcoin Intraday Levels
Spot rate: $9,490
Relative change: -295
Percentage change: -3%
Trend: Bearish
Volatility: Shrinking
As Bitcoin inched closer to $10,000 it hinted the possibility of a double-top pattern could come into the picture. This pattern is usually used in technical analysis to signal a possible reversal from a continued uptrend. In this case, if Bitcoin retests $10,000 or even better $10,100 and fails to sustain gains to higher levels based on good volume, a reversal from this pattern could sink Bitcoin to levels seen last week close to $10,000.
Liked this analysis, follow our crypto analysis page at trading view, for updates.
Play 10,000+ Casino Games at BC Game with Ease
- Instant Deposits And Withdrawals
- Crypto Casino And Sports Betting
- Exclusive Bonuses And Rewards


Why Trust CoinGape
CoinGape has covered the cryptocurrency industry since 2017, aiming to provide informative insights Read more… to our readers. Our journal analysts bring years of experience in market analysis and blockchain technology to ensure factual accuracy and balanced reporting. By following our Editorial Policy, our writers verify every source, fact-check each story, rely on reputable sources, and attribute quotes and media correctly. We also follow a rigorous Review Methodology when evaluating exchanges and tools. From emerging blockchain projects and coin launches to industry events and technical developments, we cover all facets of the digital asset space with unwavering commitment to timely, relevant information.

Delivered every day.
- Insights that move markets
- 100,000 active subscribers
Related Articles


- Senate Eyes CLARITY Act Markup This Month as Banks, Crypto Continue Stablecoin Yield Talks
- Why XRP Price Rising Today? (2 March)
- Breaking: Bitcoin Price Rises to $70k as Gold Crashes Amid U.S.-Iran Conflict
- Bitcoin News: Anthony Pompliano’s ProCap Buys 450 BTC, Gold Bug Peter Schiff Reacts
- Fed Rate Cuts More Likely If U.S.-Iran Conflict Extends, Arthur Hayes Predicts
- Top 5 Historical Reasons Dogecoin Price Is Not Rising
- Pi Coin Price Prediction for March 2026 Amid Network Upgrade, KYC Boost, Rewards Distribution
- Gold Price Nears ATH; Silver Eyes $100 Breakout on Us- Iran War
- Bitcoin And XRP Price As US Kills Iran Supreme Leader- Is A Crypto Crash Ahead?
- Gold Price Prediction 2026: Analysts Expect Gold to Reach $6,300 This Year
- Circle (CRCL) Stock Price Prediction as Today is the CLARITY Act Deadline


