 Claim Card
Bitcoin Price Has Breakout Against M1 Money Supply, Confirms Peter Brandt


Highlights
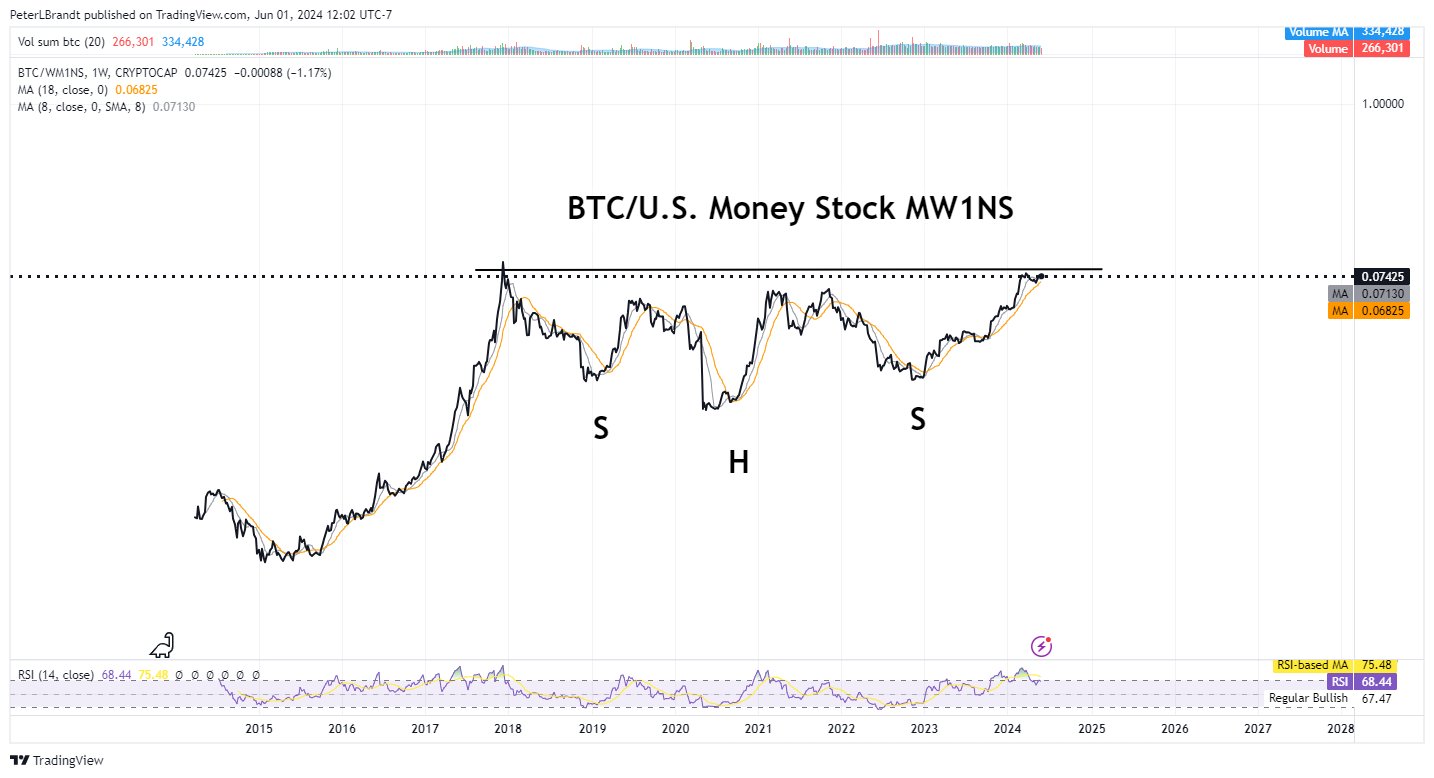
- Bitcoin price chart indicating a breakout against the M1 money supply for the first time since 2017.
- He noted the similarities in chart structure to Dow Jones industrial average during period of Great Stagflation of 1970s.
- BTC price set for major rally
Veteran trader Peter Brandt on Saturday shared a Bitcoin price chart indicating a breakout against the M1 money supply. There is a historical breakout of Bitcoin for the first time since March 2017, a similar breakout led to a parabolic rally in BTC price. Are we witnessing another breakout at least for $100K?
Bitcoin Price Prepares for Massive Rally
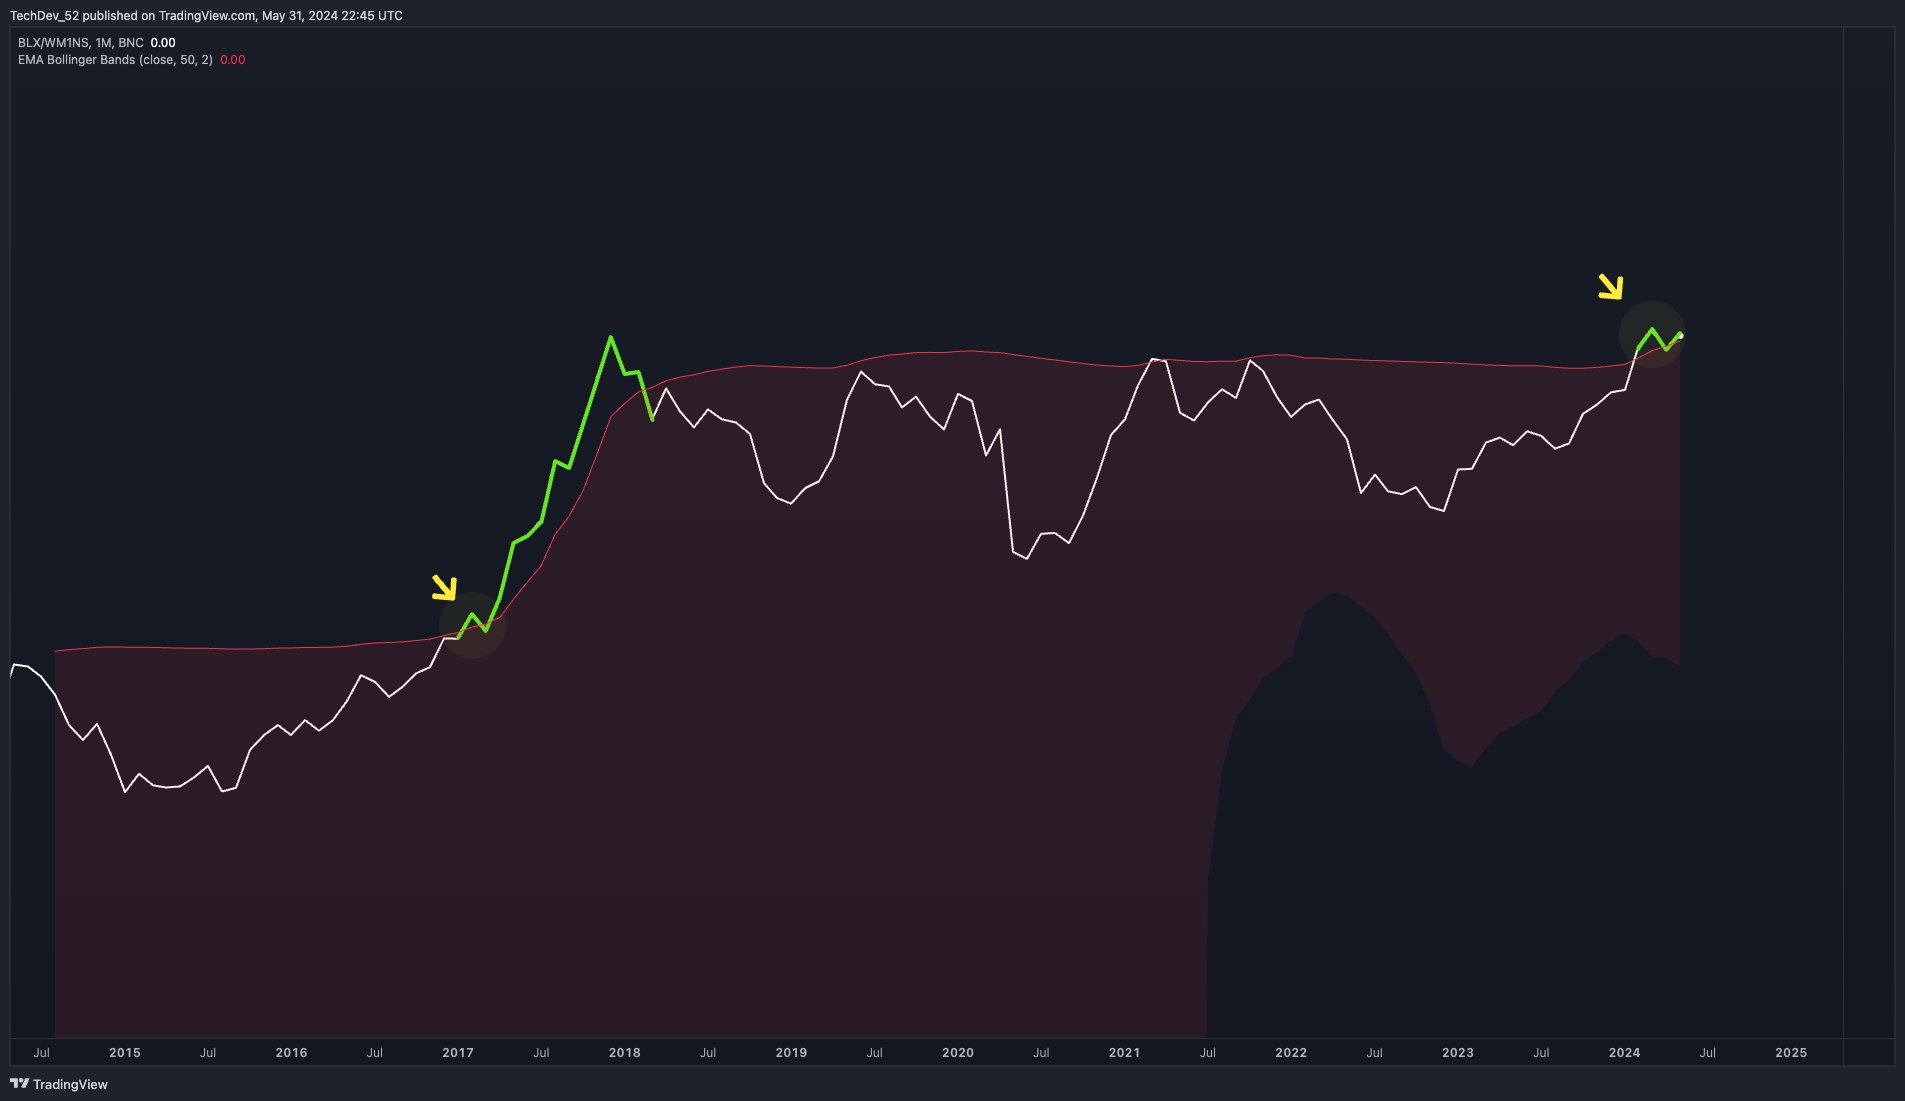
Trader Peter Brandt reacted to a chart of Bitcoin against M1 money supply by another popular analyst, noting it as absolutely amazing. Bitcoin saw first breakout against M1 money supply since 2017. He added that the “argument for Bitcoin relates to the eventual destruction of fiat currency units” such as US dollar.
The chart plots Bitcoin price in relationship to total U.S. money stock (M1). This ratio has remained below the Dec 2017 high. He noted the similarities in chart structure to Dow Jones industrial average during period of Great Stagflation of 1970s, showing continuation inverted H&S pattern.
He predicts a massive Bitcoin price rally post-breakout in the coming weeks, with analysts claiming they have never seen a Bitcoin breakout like this one.
Analyst TechDev said a historic move is imminent as people switch to Bitcoin from USD. Bitcoin 5D bullish compression has also reached its highest level in 8 years.
Also Read: Bitcoin News — Developers Debate Major BTC Network Upgrade For New Use Cases
BTC Price Forms Multiple Bullish Patterns
CoinGape reported an early cup-and-handle formation in Bitcoin price by Peter Brandt. The cup part has formed completely and the handle pattern has yet to form. Peter Brandt hints at a breakout upcoming in BTC price, with the confirmation happening after a downtrend breakout.
BTC price jumped less than 1% in the past 24 hours, with the price currently trading below $67,700. The 24-hour low and high are $67,181 and $67,818, respectively. Furthermore, the trading volume has decreased by 50% in the last 24 hours, indicating a decline in interest among traders.
Meanwhile, experts have negated the impact of Mt. Gox Bitcoin distribution on BTC price as creditors don’t plan to sell their Bitcoin in the bull market. Moreover, those who wanted to sell, plans to do it gradually or after investing the payout for maximizing gains.
Also Read: Binance Burns 1.35 Billion Terra Luna Classic, Crypto Exchange’s Net Burn Hits 60 Bln

Why Trust CoinGape
CoinGape has covered the cryptocurrency industry since 2017, aiming to provide informative insights Read more… to our readers. Our journal analysts bring years of experience in market analysis and blockchain technology to ensure factual accuracy and balanced reporting. By following our Editorial Policy, our writers verify every source, fact-check each story, rely on reputable sources, and attribute quotes and media correctly. We also follow a rigorous Review Methodology when evaluating exchanges and tools. From emerging blockchain projects and coin launches to industry events and technical developments, we cover all facets of the digital asset space with unwavering commitment to timely, relevant information.

Delivered every day.
- Insights that move markets
- 100,000 active subscribers
Related Articles


- Expert Predicts Deeper Bitcoin Decline as JPMorgan CEO Warns of Similarities to the 2008 Financial Crisis
- Trump Won’t Pardon FTX’s Sam Bankman-Fried (SBF), White House Says
- Third Spot SUI ETF Goes Live as 21Shares Fund Launches on Nasdaq
- Mark Zuckerberg’s Meta Reportedly Eyes Stablecoin Integration This Year Amid Regulatory Clarity
- Coinbase Rivals Robinhood As It Rolls Out Stocks, ETFs Trading In ‘Everything Exchange’ Push
- Cardano Price Signals Rebound as Whales Accumulate 819M ADA
- Sui Price Eyes Recovery as Third Spot SUI ETF Debuts on Nasdaq
- Pi Network Price Eyes a 30% Jump as Migrations Jumps to 16M
- Will Ethereum Price Dip to $1,500 as Vitalik Buterin Continues Selling ETH?
- XRP Price Outlook as Clarity Act Passage Odds Plunge to 53%
- COIN Stock Risks Crashing to $100 as Odds of US Striking Iran Jump


