 Buy $GGs
Bitcoin Price Prediction: BTC Prepares For A Major Liftoff To New Yearly Highs


- Bitcoin stalls at $11,400 after rejection from $11,800; support is envisaged at $11,250.
- On-chain data shows whales constantly accumulating BTC; investors anticipate price action to new yearly highs.
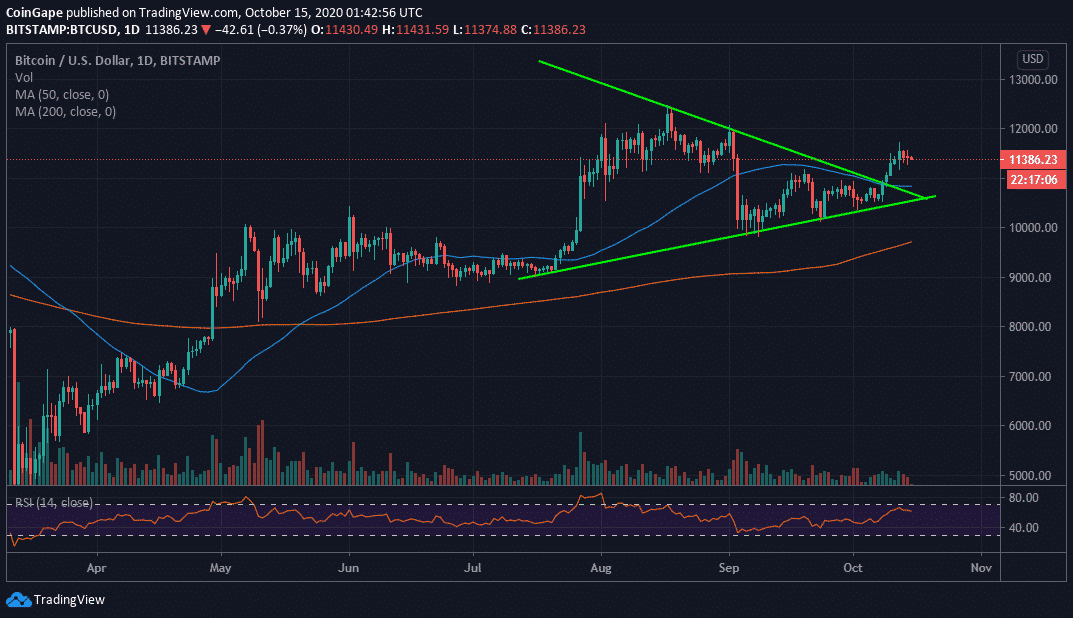
Bitcoin recently sliced through a symmetrical triangle pattern presented on the daily chart. The pattern has been discussed severally in our technical analyses. BTC closed in on the psychological resistance at $12,000 but lost momentum within a whisker of $11,800. A reversal ensued, sending Bitcoin back to support at $11,250. Meanwhile, the flagship cryptocurrency has sluggish in movement, remaining pivotal at $11,400.
According to Glassnode, a leading on-chain data analysis platform, whales have been on a constant buying spree for months. For instance, “2.6M $BTC (14% of supply) are currently held in accumulation addresses.” Note that accumulation addresses refer to those “addresses that have at least two incoming transactions and have never spent BTC.”
#Bitcoin accumulation has been on a constant upwards trend for months.
2.6M $BTC (14% of supply) are currently held in accumulation addresses.
Accumulation addresses are defined as addresses that have at least 2 incoming txs and have never spent BTC.https://t.co/VEt4a503ae pic.twitter.com/QhGqmxpv2S
— glassnode (@glassnode) October 14, 2020
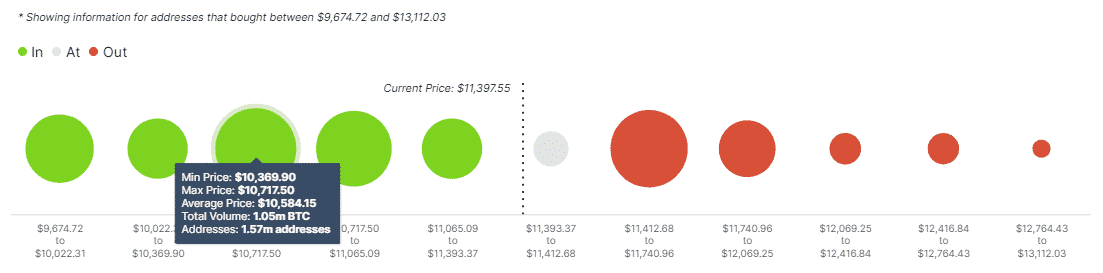
IntoTheBlock’s IOMAP model reveals the absence of a significant supply area that could prevent Bitcoin from soaring to yearly highs. However, the resistance between $11,413 and $11,740 must come down for this bullish narrative to be validated. Previously, nearly 1.5 million addresses purchased almost 923,000 BTC in the range.
On the downside, Bitcoin appears to be well protected due to the clusters of support zones offering immense support. It is doubtful that Bitcoin will spiral to $9,000 in the near term. The most robust anchor zone lies between $10,370 and $10,718, according to the model.
Bitcoin IOMAP chart
For now, short term technical analysis shows the possibility of retracement, preferably to $11,250 support before the bulls stage another breakout. The 50-day Simple Moving Average is in line to offer support above $10,800 if losses extended a bit lower. On the upside, price action is required above $11,600 and $11,800 for BTC to align with the trajectory to new yearly highs properly.
BTC/USD daily chart
BTC Intraday Levels
Spot rate: $11,380
Relative change: -45
Percentage change: -0.4
Trend: Bearish
Volatility: Low
Play 10,000+ Casino Games at BC Game with Ease
- Instant Deposits And Withdrawals
- Crypto Casino And Sports Betting
- Exclusive Bonuses And Rewards


Why Trust CoinGape
CoinGape has covered the cryptocurrency industry since 2017, aiming to provide informative insights Read more… to our readers. Our journal analysts bring years of experience in market analysis and blockchain technology to ensure factual accuracy and balanced reporting. By following our Editorial Policy, our writers verify every source, fact-check each story, rely on reputable sources, and attribute quotes and media correctly. We also follow a rigorous Review Methodology when evaluating exchanges and tools. From emerging blockchain projects and coin launches to industry events and technical developments, we cover all facets of the digital asset space with unwavering commitment to timely, relevant information.

Delivered every day.
- Insights that move markets
- 100,000 active subscribers
Related Articles


- Kraken Becomes First Crypto Firm To Secure Fed Master Account as Ripple Awaits Approval
- “There Is Only One Gold,” Billionaire Ray Dalio Says Amid BTC’s Quantum Threats
- Goldman Sachs CEO Predicts ‘Weeks’ of Crypto Market Crash as U.S Iran War Continues
- Polymarket Axes ‘Nuclear Detonation’ Prediction Market Amid Public Fury
- Indiana Signs Bitcoin Bill Into Law Allowing Crypto in Retirement Plans
- Robinhood Stock Price Prediction As Cathie Wood Buys $12M Dip in Bold ARK Move
- Bitcoin Price At Risk? Professor Who Predicted US-Iran War Says America Could Lose
- Gold Price Prediction March 2026: Rally, Crash, or Record Highs?
- RIOT Stock Prediction as Needham, Piper Sandler Slash Target After Earnings
- Cardano Price Outlook As Charles Hoskinson Warns Over CLARITY Act
- Circle Stock Price Climbs 15% to $96, Can Rally Continue in March 2026?


