 Buy $GGs
Bitcoin Price Prediction: BTC Price Could Drop 6% To $44,637


Bitcoin price dropped below the $50,000 psychological level on December 04, unravelling a possible bearish forecast. This provided a buying opportunity for investors who bought the dip, but the uptrend hit a wall and got stopped at the middle boundary of the descending parallel channel. This chart pattern continues to govern BTC’s price action pointing to further losses.
Bitcoin Price Bears Contemplate A 6 Decline To $44,637
Bitcoin price fell below the $50,000 psychological level on December 04, paving the way for further losses. The bulls of the pioneer cryptocurrency attempted to undo the losses in three straight bullish sessions between December 05 and 07, but the price action halted at the middle boundary of the governing chart pattern.
Bitcoin price is trading below the middle boundary of the descending parallel channel around $47,610 as seen on the daily chart. A descending parallel channel is a significantly bearish chart pattern that suggests a continued bearish leg as long as the price of an asset remains within the confines of the falling channel.
If Bitcoin price fails to rise above the middle boundary of the falling channel at $49,105, it may drop towards the 200-day Simple Moving Average (SMA) around $46.588. A further drop past this level could see BTC/USD drop to tag the lower boundary of the channel at $44,637, a 6.37% drop from the current price.
BTC/USD Daily Chart
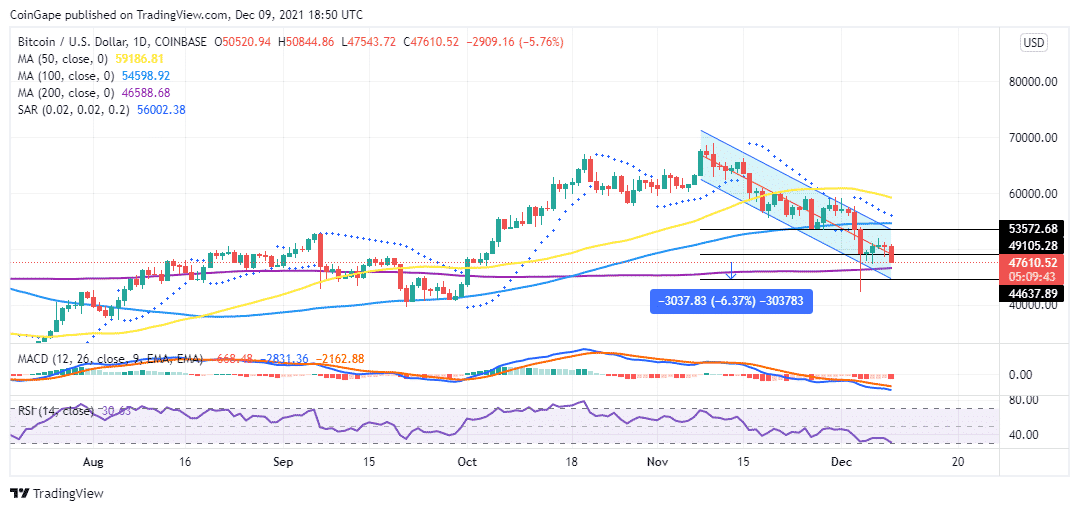
The down-sloping moving averages and the entry of the Relative Strength Index (RSI) indicator into the oversold region suggest that Bitcoin is firmly in the hands of the bears, accentuating this bearish outlook.
In addition, the position of the Moving Average Convergence Divergence (MACD) indicator below the zero line in the negative region suggests that Bitcoin’s market momentum is bearish at the moment. Moreover, the parabolic SAR is still negative and above the price, accentuating the bearish outlook.
Looking over the Fence
On the upside, Bitcoin’s bearish thesis could be invalidated if the bulls overcome the immediate resistance at $48,500. If this happens, Bitcoin price rise above the $53,572 resistance embraced by the upper boundary of the governing channel. This move may see the big crypto completely reverse the losses that began on December 04.
A movement further up could take BTC towards the $54,600 and $59,190 levels embraced by the 100- and 50-day SMAs respectively.
Play 10,000+ Casino Games at BC Game with Ease
- Instant Deposits And Withdrawals
- Crypto Casino And Sports Betting
- Exclusive Bonuses And Rewards


Why Trust CoinGape
CoinGape has covered the cryptocurrency industry since 2017, aiming to provide informative insights Read more… to our readers. Our journal analysts bring years of experience in market analysis and blockchain technology to ensure factual accuracy and balanced reporting. By following our Editorial Policy, our writers verify every source, fact-check each story, rely on reputable sources, and attribute quotes and media correctly. We also follow a rigorous Review Methodology when evaluating exchanges and tools. From emerging blockchain projects and coin launches to industry events and technical developments, we cover all facets of the digital asset space with unwavering commitment to timely, relevant information.

Delivered every day.
- Insights that move markets
- 100,000 active subscribers
Related Articles


- Goldman Sachs CEO Predicts ‘Weeks’ of Crypto Market Crash as U.S Iran War Continues
- Polymarket Axes ‘Nuclear Detonation’ Prediction Market Amid Public Fury
- Indiana Signs Bitcoin Bill Into Law Allowing Crypto in Retirement Plans
- ‘Time to Act Is Now’: CFTC Chief Pushes Swift Passage of CLARITY Act
- Trump Tells Congress to Pass Crypto Market Bill ‘ASAP,’ Blasts Banks for Stalling
- Gold Price Prediction March 2026: Rally, Crash, or Record Highs?
- RIOT Stock Prediction as Needham, Piper Sandler Slash Target After Earnings
- Cardano Price Outlook As Charles Hoskinson Warns Over CLARITY Act
- Circle Stock Price Climbs 15% to $96, Can Rally Continue in March 2026?
- Bitcoin Price Prediction as US-Iran War Enters 4th Consecutive Day
- Top 5 Historical Reasons Dogecoin Price Is Not Rising


