 Buy Presale
BNBUSDT Price Action Discovery With a Strong Bullish Volatility Expansion


- Weekly S/R Zone Bullish Retest
- Price Action Discovery Mode
- Strong Bullish Volatility
- New All-Time High Established
BNBUSDT’s, currently is trading in a Blue-Sky Breakout with a weekly candle close coming to fruition. The close will greatly dictate the overall direction in the immediate short term, as of current, the objective is the Swing High (All Time High).
BNBUSDT Weekly Price Action Chart
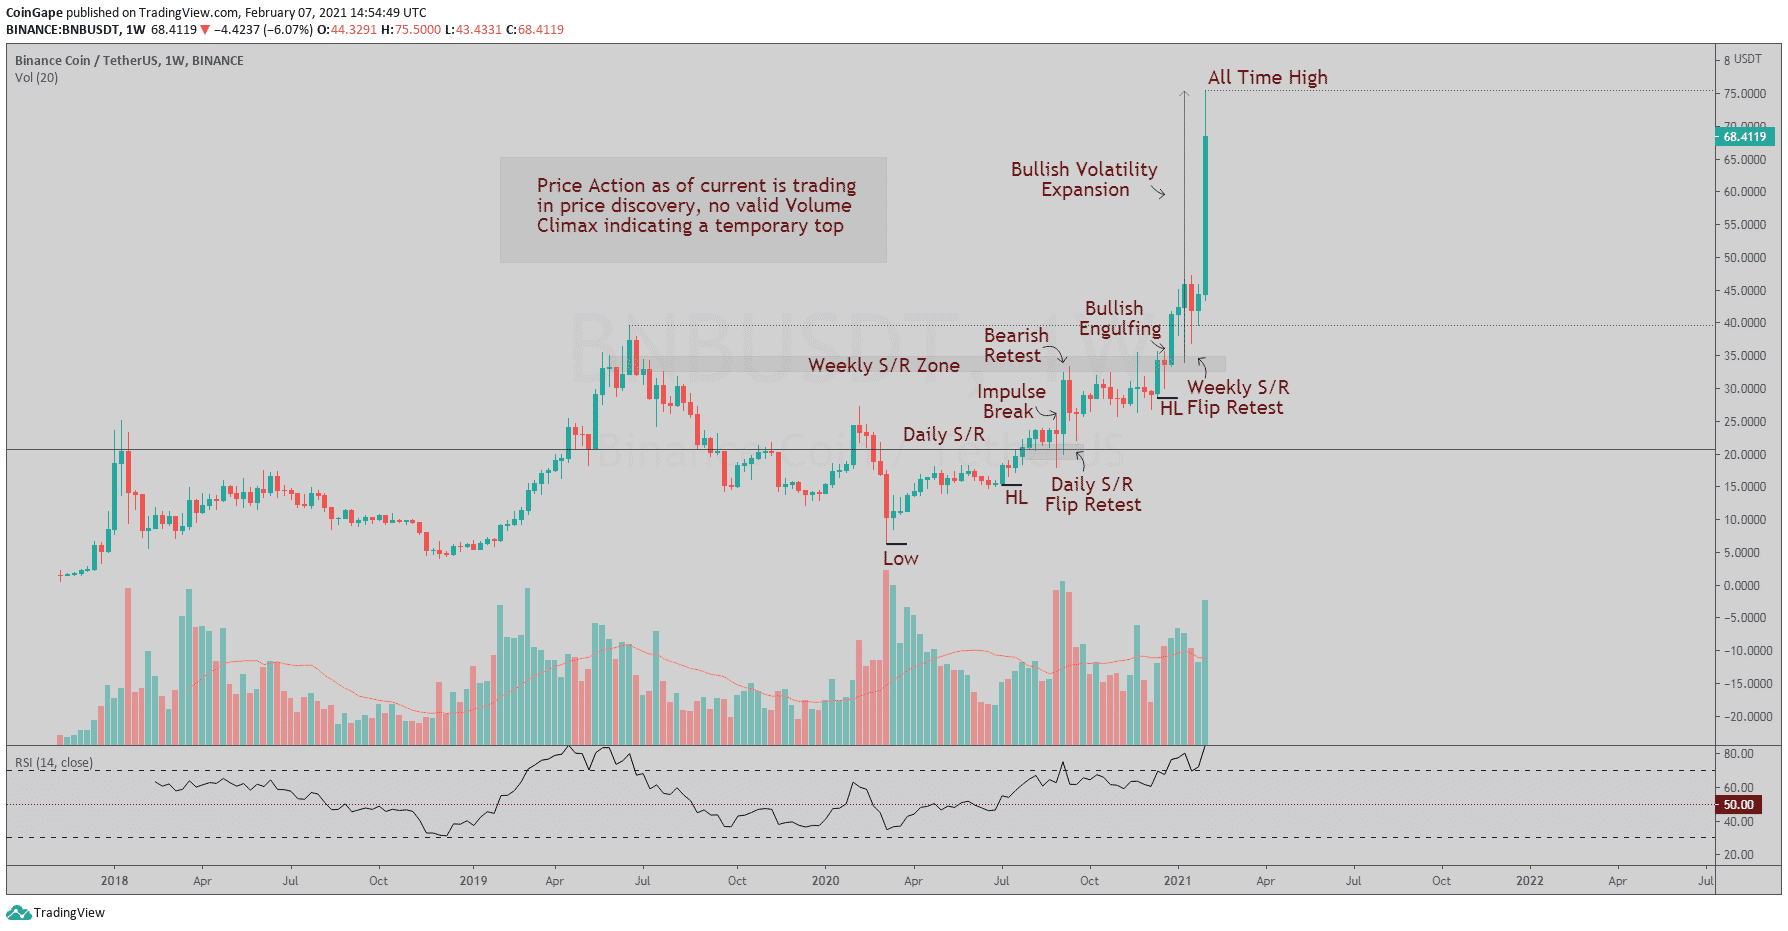
Observing the chart above, we can see a clear Daily S/R level that has been a staunched resistance until a break and retest leading into the Weekly S/R Zone. The initial test of the weekly level posed a rejection, causing Price Action to oscillate between the two key Support and Resistance Levels.
A Local Higher Low Projection between these levels was established, leading Price Action to consolidate under the Key Weekly S/R Zone. Such consolidation is deemed bullish as Price Action absorbs Supply as volatility tightens. Evidently, a Bullish Engulfing candle came to fruition, breaking the S/R Zone and confirming a retest before a continuation.
As of current, a strong Bullish Volatility Expansion has occurred, leading Price Action into All-Time Highs. Being in a Blue-Sky breakout with no valid Volume Climaxes deems further upside being highly imminent as there are no valid signs of a temporary top.
BNBUSDT Daily RSI
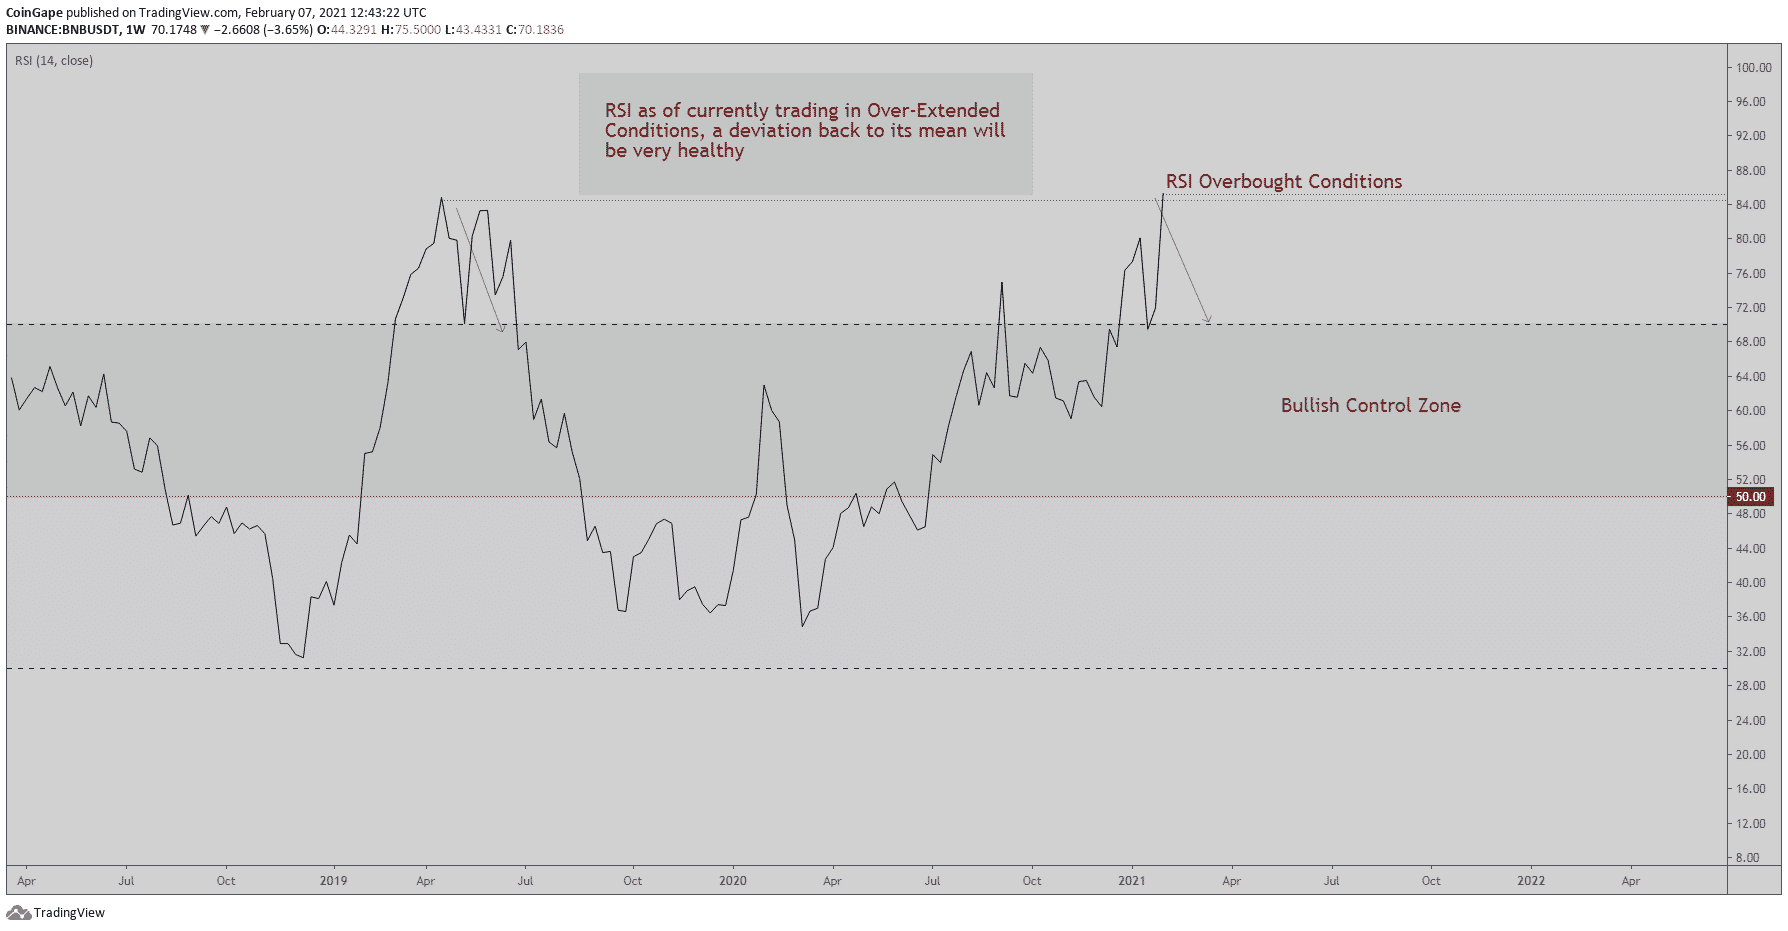
Perceiving the current RSI; trading at Overbought Conditions needs to be taken into consideration. The previous Overbought Conditions at this extreme were met with a deviation back into its Bullish Control Zone. Thus it is highly probable at some stage that a deviation will occur, holding the Bullish Control Zone will then be important to maintain a Bullish Direction Bias.
To conclude, BNBUSDT remains in Price Discovery with no signs of a temporary top such as a Volume Climax Node. The All-Time Highs is now the current objective, exceeding this level will increase the probability of a further expansion. The RSI on the other hand needs to be monitored for a deviation back into the Bullish Control Zone. Holding these regions will solidify strength in the trend, however breaking and penetrating the Bearish Control Zone will signify short-term weakness.
Hope this article helps in making discretionary trading decisions.
Play 10,000+ Casino Games at BC Game with Ease
- Instant Deposits And Withdrawals
- Crypto Casino And Sports Betting
- Exclusive Bonuses And Rewards


Why Trust CoinGape
CoinGape has covered the cryptocurrency industry since 2017, aiming to provide informative insights Read more… to our readers. Our journal analysts bring years of experience in market analysis and blockchain technology to ensure factual accuracy and balanced reporting. By following our Editorial Policy, our writers verify every source, fact-check each story, rely on reputable sources, and attribute quotes and media correctly. We also follow a rigorous Review Methodology when evaluating exchanges and tools. From emerging blockchain projects and coin launches to industry events and technical developments, we cover all facets of the digital asset space with unwavering commitment to timely, relevant information.

Delivered every day.
- Insights that move markets
- 100,000 active subscribers
Related Articles


- Prediction Market News: Kalshi Fines MrBeast Associate Over Insider Trading Amid State Crackdown
- CLARITY Act: Banks, Crypto Yet To Agree On New Crypto Bill Draft As March 1 Deadline Looms
- Michael Saylor Predicts $50T From Bonds Could Flow Into Bitcoin Ecosystem as Digital Credit Evolves
- Bitcoin Treasury Firm GD Culture Authorizes Sale of 7,500 BTC as Expert Warns Of More ‘Pain’
- USDT And USAT Get Adoption Boost as Tether Invests in Whop for Faster Settlements
- Will Solana Price Rally to $100 If Bitcoin Reclaims $72K?
- XRP Price Eye $2 Rebound as On-Chain Data Signals Massive Whale Accumulation
- Ethereum Price Reclaims $2K- New Rally Ahead or a Temporary Bounce?
- COIN Stock Price Prediction as Wall Street Pros Forecast a 62% Surge
- Cardano Price Signals Rebound as Whales Accumulate 819M ADA
- Sui Price Eyes Recovery as Third Spot SUI ETF Debuts on Nasdaq


