 Buy Presale
BTC Price Analysis: Bearish Divergence On Weekly Charts Signal Intraday Sideways Market Structure


Bitcoin (BTC) price after creating a new all time high of $67k is sitting at $61.5k at the time of reporting. Bitcoin Uptrend seems to have slowed on lower time frames due to metaverse coins like Decentraland (MANA) & Sandbox (SAND) stealing major attention post Facebook’s brand update.
What’s New For Bitcoin (BTC)?
- The recent launch of Bitcoin ETFs has staged new talks on the safety of investment products that are backed by cryptocurrencies. However, blockchain and crypto-based firms relentlessly continue to submit proposals.
- Steve Wozniak the legendary tech innovator in a recent interview with Yahoo! Finance stated that Bitcoin represents mathematical purity and that the US dollar is not fixed since the government can simply print more money at will and continue to borrow.
- The Australian Senate Committee recently recommends a clearer, friendly, and robust regulatory framework for the ever-growing crypto ecosystem in the nation.
Let’s analyze the BTCUSDT charts for insights into possible bullish and bearish scenarios.
Bitcoin (BTC) Price Analysis: Weekly Chart
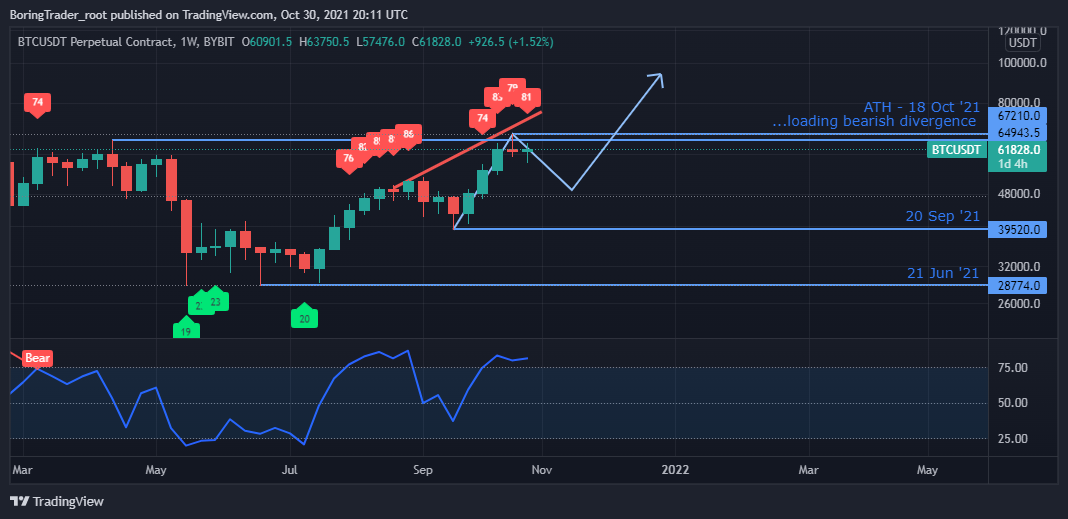
Looking at the weekly chart of the BTCUSDT, the $61828.0 resistance level continues to resist further price increase since last week’s closing price.
We view a price close above the significant bearish divergence resistance at $67210.00 could confirm a massive demand for BTC and perhaps a quick climb to the $100K round-number resistance.
On the contrary, if the bearish divergence stays true, we could see a price pull-back for the BTCUSDT, where an uptrend is still possible if the price continues to trade above $39520.00 and a deeper correction with a breakdown below the $39520.00 support.
Bitcoin (BTC) Price Analysis: Daily Chart

The daily time frame shows the BTCUSDT trading within a bullish ascending channel established by opposing bearish and bullish divergence setups with support and resistance levels at $57963.0 and $66663.40.
- Similar to the weekly time frame, we should see a continuation of the uptrend if we can see a bullish closing price above the $66663.40 resistance.
- Conversely, a price slump below the $57963.00 would confirm bearish dominance and a change of trend polarity to the downside.
The relative strength index continues to print higher values above level-25 at press time, hence the uptrend is still intact.
Bitcoin (BTC) Price Analysis: 4 hr Chart
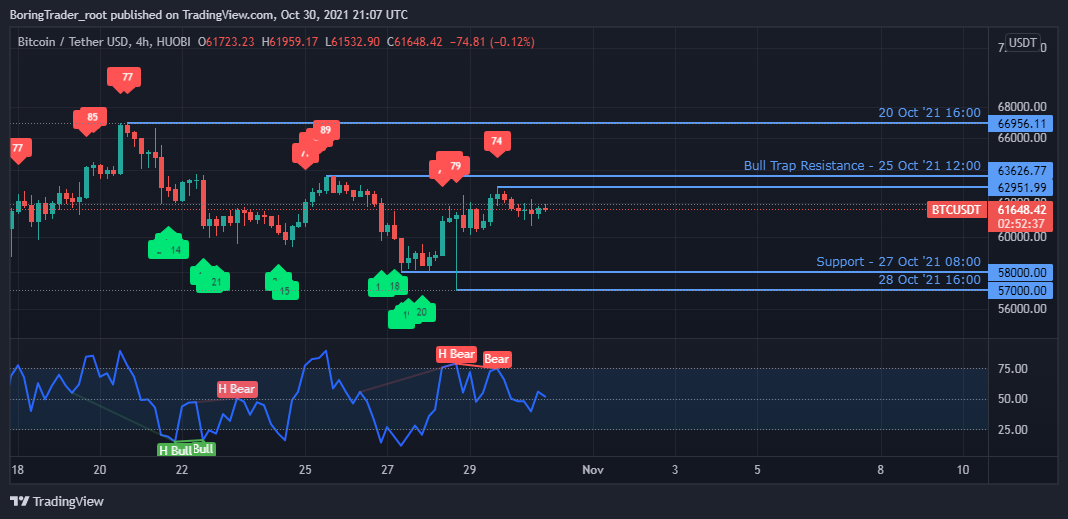
The long candlewick of the 28 Oct 16:00 shows that the BTCUSDT may have found support at the $57000.00 round-number price zone and we could see a further hike from growing demand for Bitcoin. Growing demand for Bitcoin would translate to the BTC price closing above the bearish divergence resistance at $62951.99.
A collapse of the $57K support would suggest a prolonged price correction to the downside.
Play 10,000+ Casino Games at BC Game with Ease
- Instant Deposits And Withdrawals
- Crypto Casino And Sports Betting
- Exclusive Bonuses And Rewards


Why Trust CoinGape
CoinGape has covered the cryptocurrency industry since 2017, aiming to provide informative insights Read more… to our readers. Our journal analysts bring years of experience in market analysis and blockchain technology to ensure factual accuracy and balanced reporting. By following our Editorial Policy, our writers verify every source, fact-check each story, rely on reputable sources, and attribute quotes and media correctly. We also follow a rigorous Review Methodology when evaluating exchanges and tools. From emerging blockchain projects and coin launches to industry events and technical developments, we cover all facets of the digital asset space with unwavering commitment to timely, relevant information.

Delivered every day.
- Insights that move markets
- 100,000 active subscribers
Related Articles


- Vitalik Buterin Exceeds Planned Ethereum Sales as Total Liquidations Hit $35M
- Circle Stock Jumps 35% on Stablecoin Boom, USDC Supply Soars 72%
- Democrats Convene US Senate Crypto Bill Meeting as a16z Briefs Republicans on CLARITY Act & AI
- After 820% Gains: Privacy Coins Evolve into Payment Rails
- Bitcoin Price Rebounds as Jane Street “10 am Dump” Pattern Stops Amid Lawsuit
- Dogecoin, Cardano, and Chainlink Price Prediction As Crypto Market Rebounds
- Will Solana Price Rally to $100 If Bitcoin Reclaims $72K?
- XRP Price Eye $2 Rebound as On-Chain Data Signals Massive Whale Accumulation
- Ethereum Price Reclaims $2K- New Rally Ahead or a Temporary Bounce?
- COIN Stock Price Prediction as Wall Street Pros Forecast a 62% Surge
- Cardano Price Signals Rebound as Whales Accumulate 819M ADA


