 Buy $GGs
BTC Price Analysis: Bearish Divergence Signal On the Weekly May Cool off Intraday Longs


The long-awaited Bitcoin BTC ETF-Exchange Traded Fund is now approved by the US SEC, and it’s viewed as a positive development for the entire cryptocurrency market. Analysts suggest that the crypto market could see capital flowing in, with speculations around investors moving out of Gold ETFs into Bitcoin.
Let’s analyze the BTCUSDT charts for insights into the recent price action.
Bitcoin (BTC) Weekly Chart Analysis
The Bitcoin price is back on the headlines of many digital media outlets as many analysts speculate on a price surge beyond the 2021 ATH. However, while the price is pumping real hard at press time, we also want to bring your attention to bearish reversal chart patterns that could lead to temporary retraction of the recent upswing.
A prominent bearish correction signal is an impending regular bearish divergence signal on the weekly chart above, where the RSI forms a lower peak [82] compared to the price chart setting a higher peak.
We anticipate a cool off of the BTC price if the RSI value stays below level-87 in the coming week.
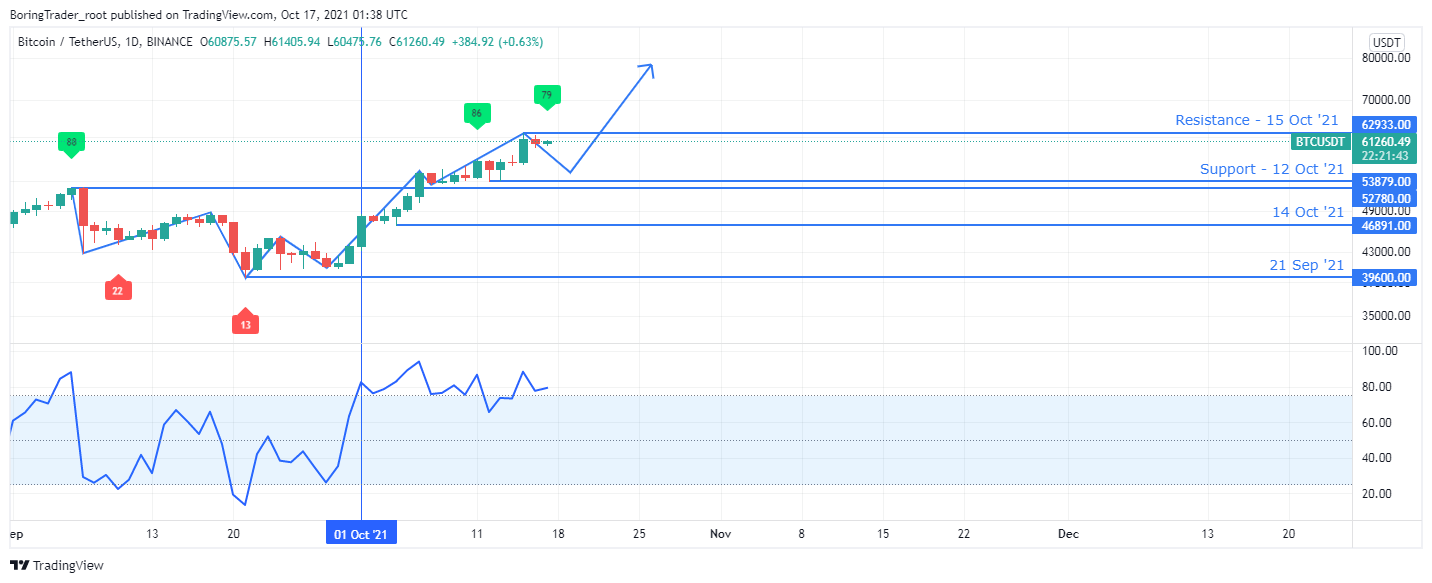
Bitcoin (BTC) Daily Chart Analysis
A view from the daily time frame shows the start of a bullish campaign on 01 October ’21 after the RSI crossed above level-75 and has not dropped below level-25 ever since.
The Bitcoin BTC price continues to set new highs and is recently shy of the all-time high at $64854.00, as the relative strength index forms a lower peak [79] signaling a likely price pull-back to come.
We expect the upward price momentum to persist till the end of the current week, given that the RSI continues to trade above level-25.
While we are optimistic of a spike in demand for the BTC, we also suggest putting some funds on the sideline for a possible price dip which can be viewed with the RSI slumping below level-25 on the daily time frame.
Bitcoin (BTC) 4 Hr Chart Analysis
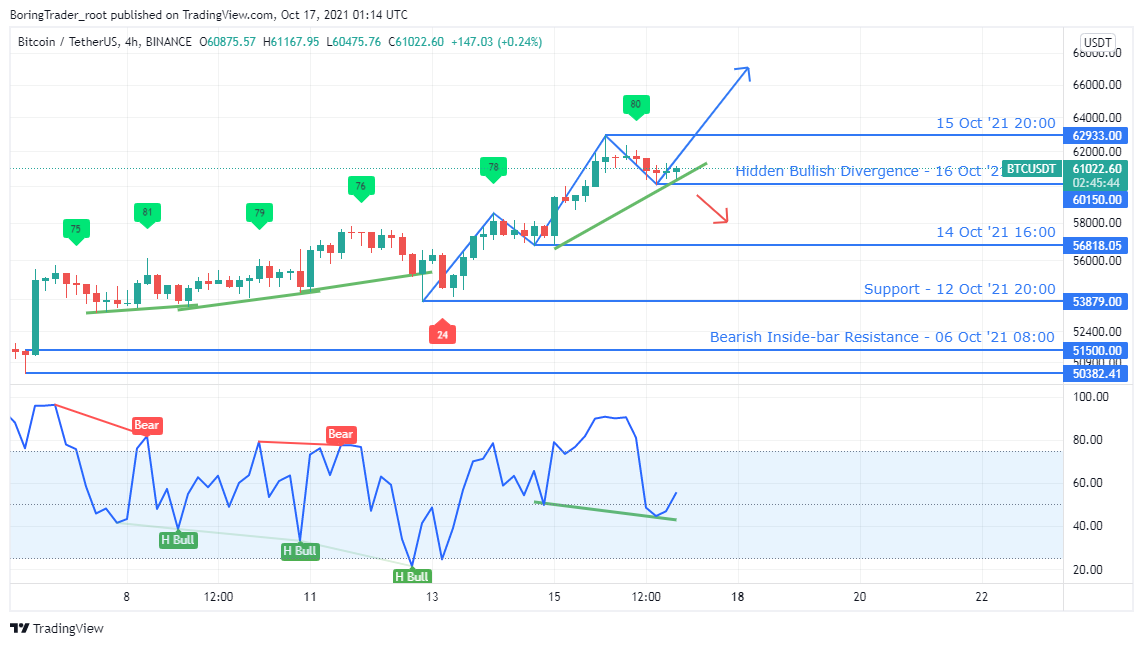
The 12 October 20:00 support [$53879] confirmed the price correction on the daily time frame setting the BTC price back into a series of higher peaks and troughs.
A recent hidden bullish divergence at press time marks an end to the 3.8% correction from this week’s high.
However, a price breakdown below the hidden bullish divergence trend line would spark a rapid sell-off of the BTC price into lower price zones, perhaps around the $58k mark.
Play 10,000+ Casino Games at BC Game with Ease
- Instant Deposits And Withdrawals
- Crypto Casino And Sports Betting
- Exclusive Bonuses And Rewards


Why Trust CoinGape
CoinGape has covered the cryptocurrency industry since 2017, aiming to provide informative insights Read more… to our readers. Our journal analysts bring years of experience in market analysis and blockchain technology to ensure factual accuracy and balanced reporting. By following our Editorial Policy, our writers verify every source, fact-check each story, rely on reputable sources, and attribute quotes and media correctly. We also follow a rigorous Review Methodology when evaluating exchanges and tools. From emerging blockchain projects and coin launches to industry events and technical developments, we cover all facets of the digital asset space with unwavering commitment to timely, relevant information.

Delivered every day.
- Insights that move markets
- 100,000 active subscribers
Related Articles


- Breaking: Oil Prices Climb as Iran Set To Deploy Mines in Strait of Hormuz
- Why Is Crypto Market Up Today? 5 Key Reasons Behind the Rally
- Top U.S. Banks Weigh Lawsuit Against OCC Over Crypto Firm Charters
- CLARITY Act: Key Democrat Says Banks May Have to Compromise as Senate Eyes Crypto Bill’s Markup
- XRP News: Brad Garlinghouse Predicts ‘Defining Year’ For Ripple With XRP At The Center
- XRP Price Prediction as Goldman Sachs Becomes Biggest Holder of Ripple ETFs
- Circle (CRCL) Stock Price Prediction Ahead of CPI Data Release-Is 120 Next?
- Bitcoin Price Today: President Trump Signals Iran Conflict May End Soon As BTC Eyes $72k
- Top Analyst Explains Why Pi Network Price May Soar to $0.50 This Week
- Is MSTR Stock Going to Rally $150?
- Bitcoin And XRP Price Prediction As US Oil Prices Fall Sharply- Will This Spark a New Bull Rally?


