 Buy $GGs
BTC Price Analysis: Is $25,000 Next Amid Bullish RSI Divergence?


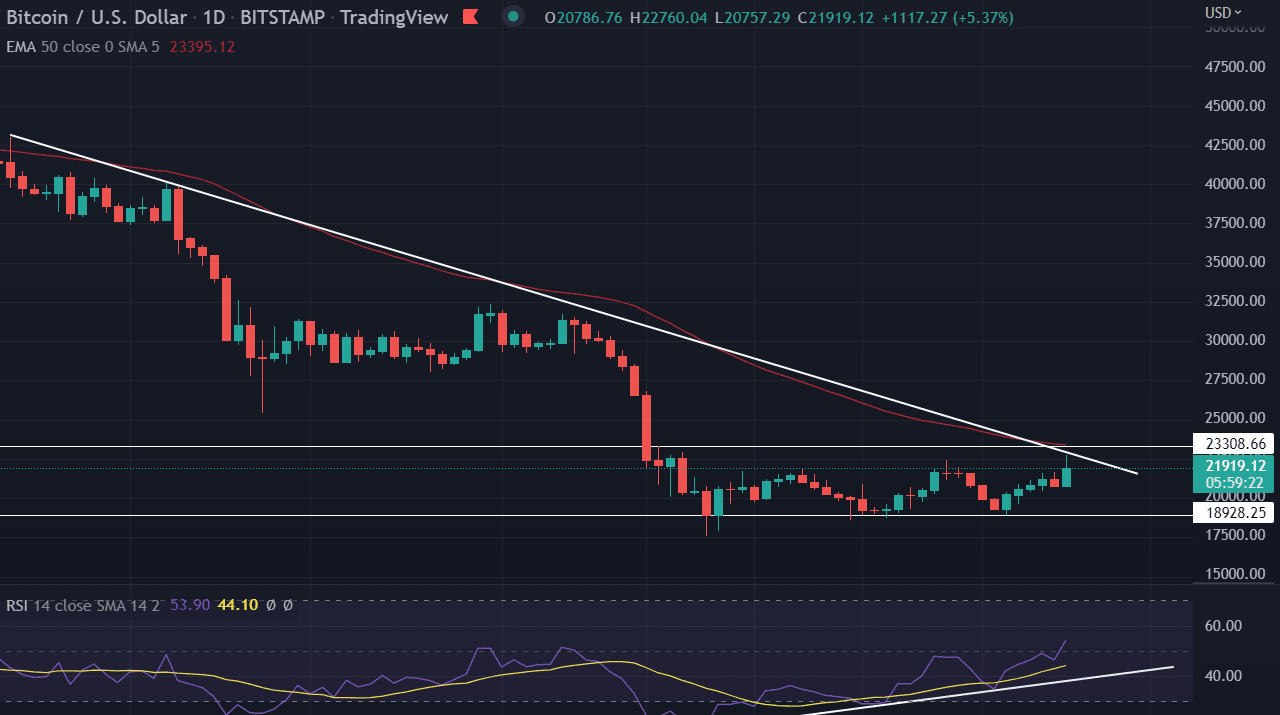
Bitcoin price trades higher on Monday. The asset makes a steady move toward the $22,000 level for a short-term upside target. The descending trend line from the highs of $42,980 acts as a strong upside barricade for the bulls. A sustained buying pressure could result in the breakout of the filter.
- BTC price refreshes monthly high above $22,000.
- Bulls attempt recovery above 50-day EMA toward $25,000.
- However, strong resistance is placed at around $23,000 on the daily chart.
BTC looks for upside gains
BTC price exhibits a consolidative price action trapped in a range of $18,000-$22,000 for the past month. ETH has already been given a breakout from its range, but BTC, the major crypto hasn’t yet.
BTC touched its resistance in today’s session but retraced sharply from the higher of level $22,700. After falling 45%, in just two-week, it’s difficult for any script to move back up again. We chart out two possible outcomes for the asset.
- Drop-base-Drop: – After a great fall, the asset tends to go into a range for some time to create a Base for the next directional setup. Next, If the price breaks base Support, then usually, coins tend to go lower, similar to the previous fall.
- Drop-base-Rally: – In this scenario, after the fall the asset goes into a range for a few days or months, called the BASE, and if the price breaks the base resistance, the price can move towards its previous swing high.
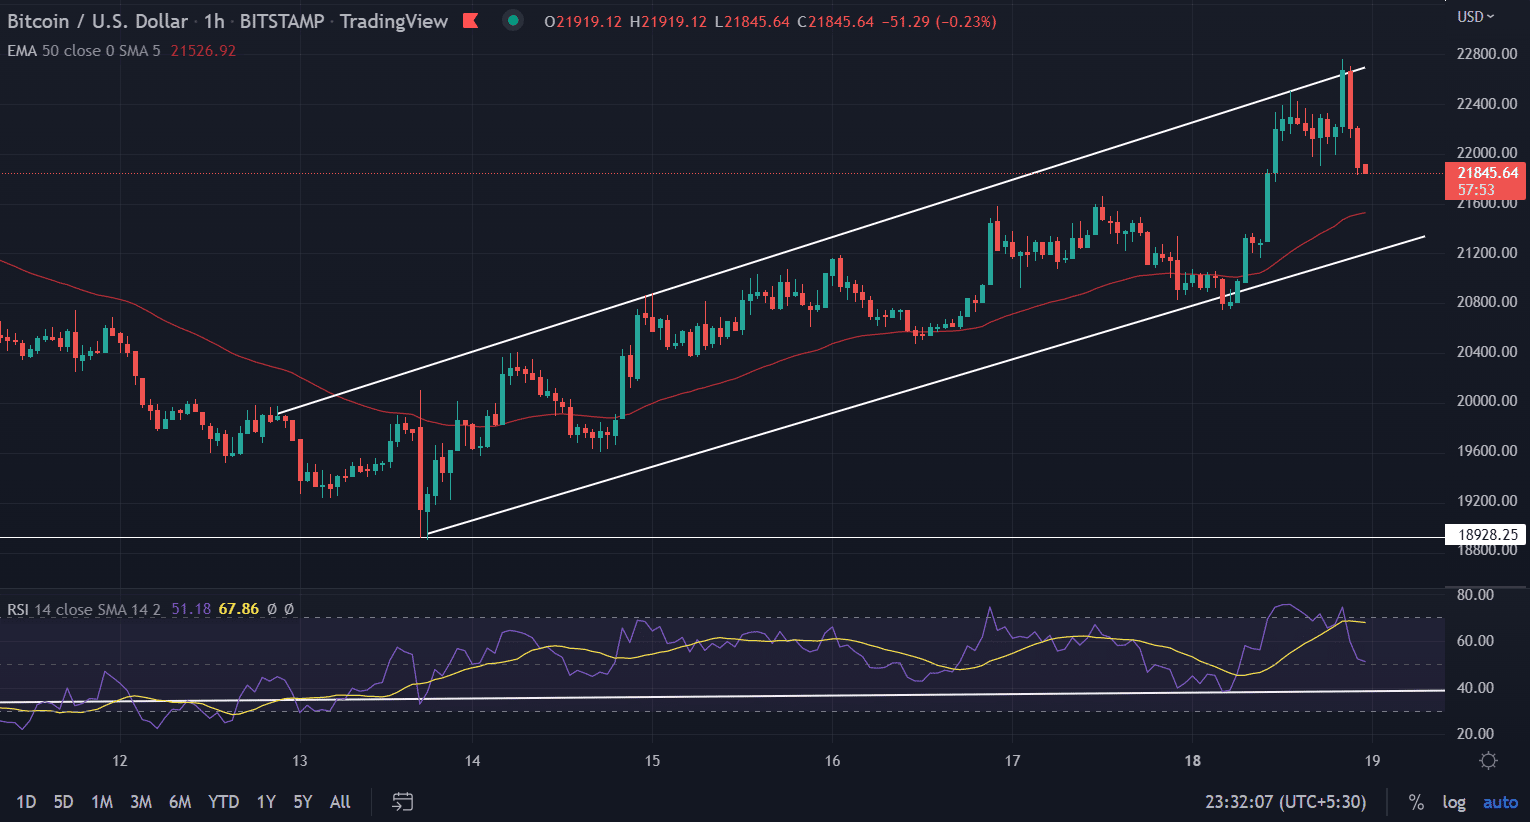
On the hourly chart, the BTC price is making higher highs and higher lows. The asset is trading in a rising channel consisting of support & resistance. The price could test the lower trend line placed at $21,200 before moving higher.
BTC on a daily time frame is still trading in a short-term trading range. To continue with the upside movement the price must meet the 50-day EMA placed at $23,393.32.
The RSI (14) gives a bullish divergence on the daily chart. It reads at 54.
Play 10,000+ Casino Games at BC Game with Ease
- Instant Deposits And Withdrawals
- Crypto Casino And Sports Betting
- Exclusive Bonuses And Rewards


Why Trust CoinGape
CoinGape has covered the cryptocurrency industry since 2017, aiming to provide informative insights Read more… to our readers. Our journal analysts bring years of experience in market analysis and blockchain technology to ensure factual accuracy and balanced reporting. By following our Editorial Policy, our writers verify every source, fact-check each story, rely on reputable sources, and attribute quotes and media correctly. We also follow a rigorous Review Methodology when evaluating exchanges and tools. From emerging blockchain projects and coin launches to industry events and technical developments, we cover all facets of the digital asset space with unwavering commitment to timely, relevant information.

Delivered every day.
- Insights that move markets
- 100,000 active subscribers
Related Articles


- From Mining Pool to Infrastructure Platform: Nine Years of EMCD
- U.S.-Iran War: U.S. Oil Prices Spike To One-Year High, Bitcoin and Gold Dip
- Crypto Traders Bet Against U.S.-Iran Ceasefire This Month as Iran Denies Peace Talks
- Ripple Prime Adds Support For Bitcoin, Ethereum, XRP, Solana Derivatives on Coinbase
- Bitcoin Price Still Risks Decline If Iran War Mirrors Ukraine War Market Reaction, JPMorgan Warns
- HOOD Stock Targets $100 as Robinhood Unveils Platinum Card and Advance Dividend Feature
- Bitcoin Price Prediction if Donald Trump Signs the CLARITY Act on April 3, 2026
- Pi Network Price As BTC Rallies Above $74K: Can PI Coin Extend Gains to $0.30?
- XRP Price As Bitcoin Reclaims $74K- Is $5 Next?
- Dogecoin Price Outlook as BTC Recovers Above $73,000
- XRP Price Prediction as Iran-U.S. Peace Talks Trigger a Crypto Rally


