 Buy $GGs
BTCUSD Price Analysis: BTC Trades In Important Channel For Now, Huge Resistance at $10k Again


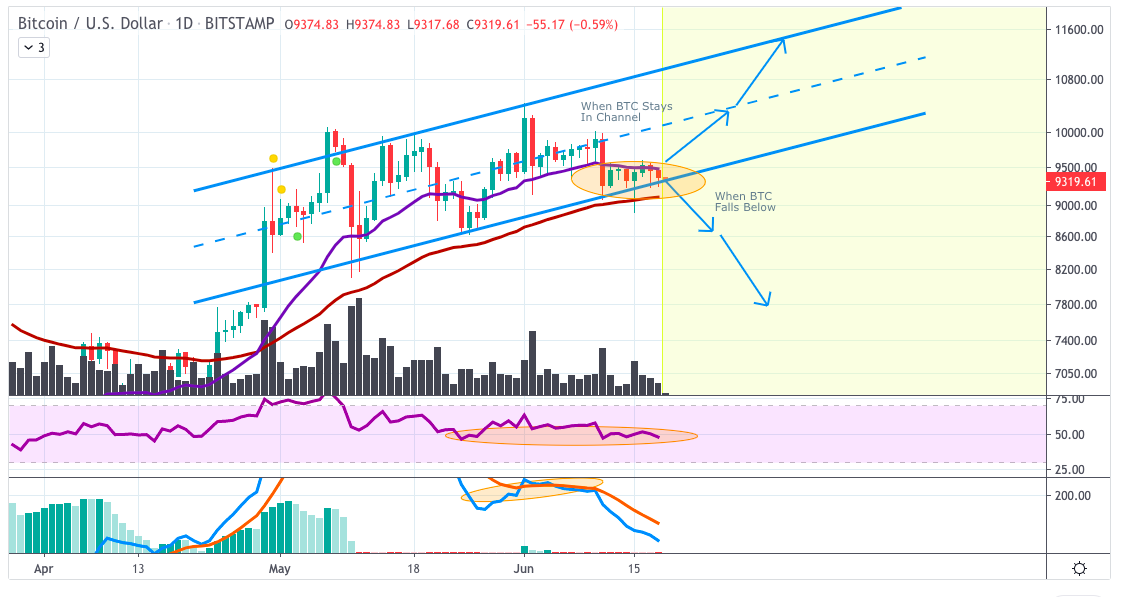
BTCUSD is trading in a channel parallel in price with the resistance at $10,000 which is important because it is a huge resistance which can confirm again.
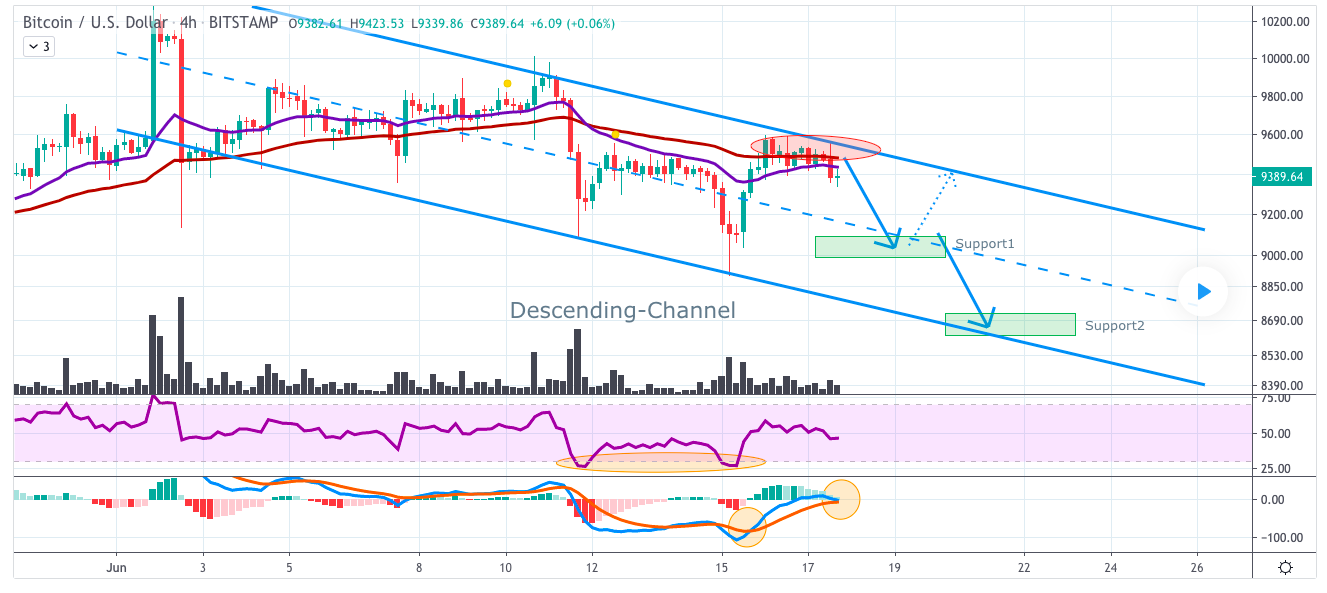
BTCUSD Price Analysis: 4 Hr Chart
BTCUSD is trading above the 55 and 20-EMAs which is a bullish but when it falls below the EMAs it is bearish and continues to be bearish. The RSI is showing moderate options in the middle which can visit the lower or upper value because that is what the RSI normally shows
The MACD provided a bearish cross which is bearish! So this can be a sign that BTC can look for more bearish signs. The next is important if BTC holds the channel or falls below it both will show the outcome in the direction when it holds about it’s bullish when it falls below its bearish.
- TREND: Sideway
- EXPECTATION: Holding of channel or falling below
- TREND AFTER EXPECTATION: volatility
- PREV: 9461.29
- OPEN: 9459.82
- VOLUME: 3.51K
- DAY’S RANGE: 9250.00 — 9478.69
Play 10,000+ Casino Games at BC Game with Ease
- Instant Deposits And Withdrawals
- Crypto Casino And Sports Betting
- Exclusive Bonuses And Rewards


Why Trust CoinGape
CoinGape has covered the cryptocurrency industry since 2017, aiming to provide informative insights Read more… to our readers. Our journal analysts bring years of experience in market analysis and blockchain technology to ensure factual accuracy and balanced reporting. By following our Editorial Policy, our writers verify every source, fact-check each story, rely on reputable sources, and attribute quotes and media correctly. We also follow a rigorous Review Methodology when evaluating exchanges and tools. From emerging blockchain projects and coin launches to industry events and technical developments, we cover all facets of the digital asset space with unwavering commitment to timely, relevant information.

Delivered every day.
- Insights that move markets
- 100,000 active subscribers
Related Articles


- Bitcoin News: Anthony Pompliano’s ProCap Buys 450 BTC, Gold Bug Peter Schiff Reacts
- Fed Rate Cuts More Likely If U.S.-Iran Conflict Extends, Arthur Hayes Predicts
- Breaking: Ethereum Treasury BitMine Adds 50,928 ETH as Tom Lee Predicts March Bottom For Crypto Prices
- Bitget Champions Women’s Role in Crypto as Part of International Women’s Day Campaign
- Breaking: Michael Saylor’s Strategy Adds 3,015 BTC as Bitcoin Holds Steady Despite U.S.-Iran War
- Pi Coin Price Prediction for March 2026 Amid Network Upgrade, KYC Boost, Rewards Distribution
- Gold Price Nears ATH; Silver Eyes $100 Breakout on Us- Iran War
- Bitcoin And XRP Price As US Kills Iran Supreme Leader- Is A Crypto Crash Ahead?
- Gold Price Prediction 2026: Analysts Expect Gold to Reach $6,300 This Year
- Circle (CRCL) Stock Price Prediction as Today is the CLARITY Act Deadline
- Analysts Predict Where XRP Price Could Close This Week – March 2026


