 Buy $GGs
BTCUSD Price Analysis: Bitcoin Again In Bullish Range, Finds Support At The EMAs


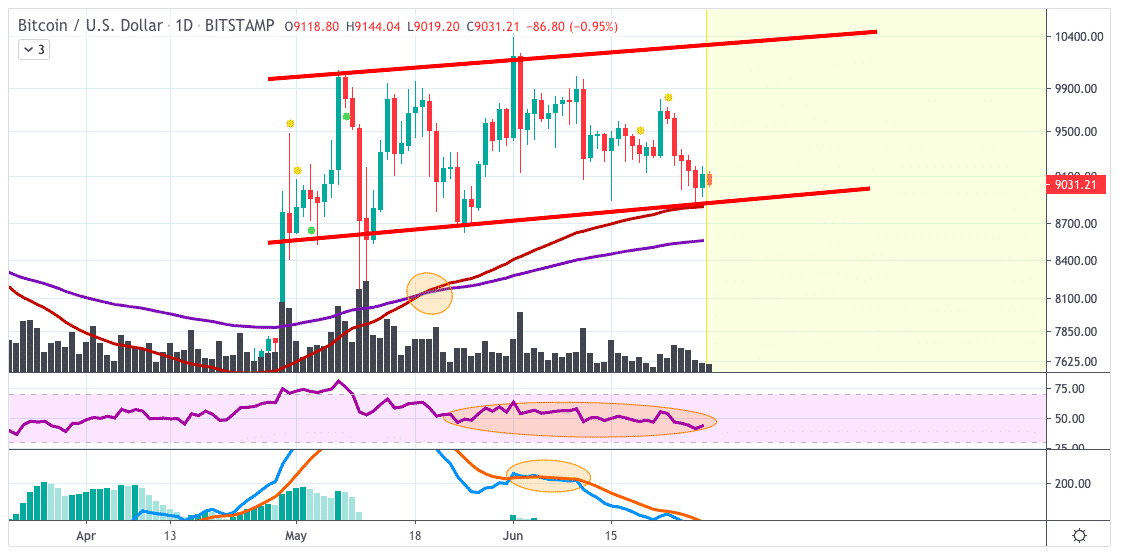
BTCUSD price has found support at the 200-EMA which is a good sign and also it provided a bullish EMA crossover in the past which is holding the trending up.
BTCUSD Price Analysis: 1 D Chart
For now, BTCUSD is forming this huge parallel channel where it has the possibility to form a bullish flag when the flag confirms to the upside.
The volume is decreasing which means it can increase in volume and volatility soon. After the trend has confirmed we will see how bullish BTCUSD really is. The RSI is sending moderate signs where it is consolidating in the middle line this can
mean it will visit the oversold or overbought region when the price is trending.
The MACD shows some mixed signs where it confirmed a bearish crossover but this was not really valid because the MACD is slinging in one and another.
- TREND: Sideways, support found
- FORMATION: Possible Bull-Flag
- EXPECTATION: Breakout
- PREV: 9009.30
- OPEN: 9008.33
- VOLUME: 3.073K
- DAY’S RANGE: 8933.06 — 9191.72
Play 10,000+ Casino Games at BC Game with Ease
- Instant Deposits And Withdrawals
- Crypto Casino And Sports Betting
- Exclusive Bonuses And Rewards


Why Trust CoinGape
CoinGape has covered the cryptocurrency industry since 2017, aiming to provide informative insights Read more… to our readers. Our journal analysts bring years of experience in market analysis and blockchain technology to ensure factual accuracy and balanced reporting. By following our Editorial Policy, our writers verify every source, fact-check each story, rely on reputable sources, and attribute quotes and media correctly. We also follow a rigorous Review Methodology when evaluating exchanges and tools. From emerging blockchain projects and coin launches to industry events and technical developments, we cover all facets of the digital asset space with unwavering commitment to timely, relevant information.

Delivered every day.
- Insights that move markets
- 100,000 active subscribers
Related Articles


- Bitget Unveils MotoGP-Inspired ‘Smarter Speed Challenge’ for Crypto, Stocks, and Gold Trading in Latest UEX Push
- XRP News: XRPL Set to Add Options Trading for Investors Amid Major Upgrade
- Is World War III Near? Bitcoin Price Drops As UK, France, Germany Consider Iran Action
- Is Bitcoin Dead? Here’s What the Data Really Says
- US-Iran War: Meme Coin Market Plunges After Iranian Drone Hits US Embassy in Kuwait
- Bitcoin And XRP Price As US Kills Iran Supreme Leader- Is A Crypto Crash Ahead?
- Gold Price Prediction 2026: Analysts Expect Gold to Reach $6,300 This Year
- Circle (CRCL) Stock Price Prediction as Today is the CLARITY Act Deadline
- Analysts Predict Where XRP Price Could Close This Week – March 2026
- Top Analyst Predicts Pi Network Price Bottom, Flags Key Catalysts
- Will Ethereum Price Hold $1,900 Level After Five Weeks of $563M ETF Selling?


