
CAKE Price Analysis: Pancake Swap (CAKE) All Set for A Breakout to Upside


The Pancake Swap DEX on the Binance Smart Chain recently announced the execution of its scheduled token burn via its Twitter handle on 12 October. Its scheduled CAKE burn function results in a token burn of more than 7million CAKE tokens valued at around 132 million USD.
The recent Pancake DEX token burn, though significant for CAKE HODLERs fell 21 million USD short of the August burn, which was at 153 million USD.
The Pancake Swap protocol also mentioned the buyback of CAKE tokens worth 3.8 million USD from the trading, NFT, and Prediction market, which translates to 719K USD from lottery, 2.8 million USD from PancakeSquad NFTs, and 153K USD from NFTs profiles.
Another notable event for the BSC decentralized exchange is the launch of BeagleCake, a DeFi project that runs on the PancakeSwap network. BeagleCake aims to leverage the massive user adoption on the PancakeSwap ecosystem with main features such as automatic buybacks, NFT Marketplace, Lottery, and Dividends redistribution.
Let’s analyze the price charts of the CAKEUSDT following a top-down approach and see how these events suggest CAKE price direction.
Pancake Swap (CAKE) Weekly Chart Analysis
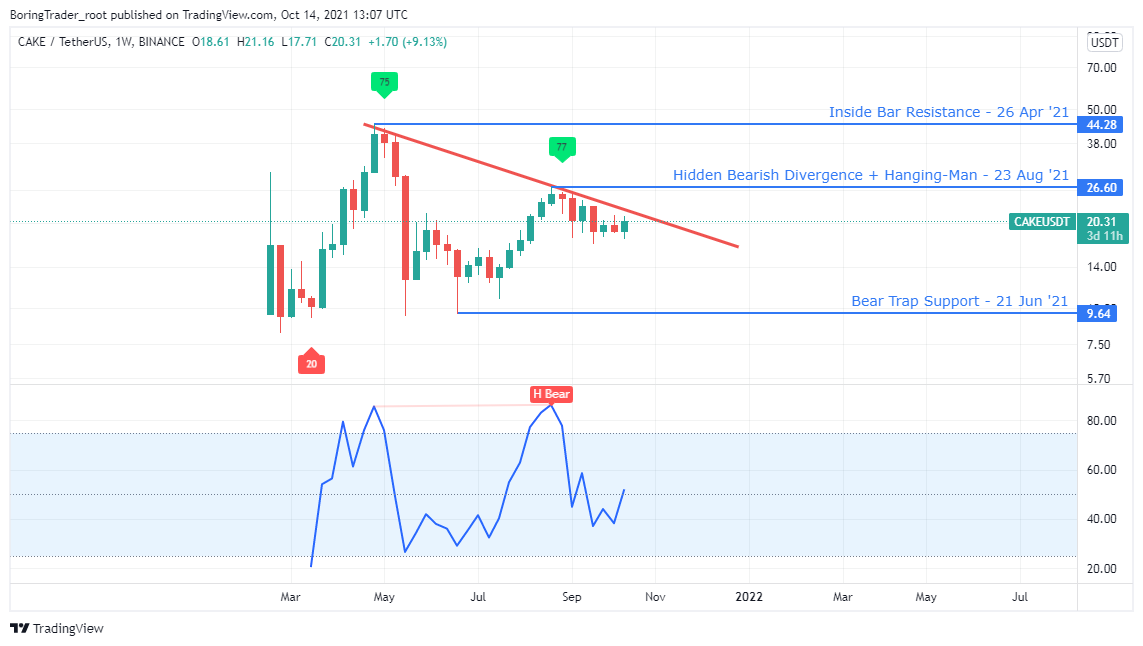
Starting from the weekly time frame, the CAKEUSDT exchange rate slumped by roughly 75% upon exiting the overbought area [level-75].
The bear trap candlestick pattern on 21 June ’21 confirmed the price floor sending the RSI back towards level-75.
A recent hidden bearish divergence on 23 August ’21 [26.60] and the 21 June bull trap support [9.64] puts the CAKEUSDT into a descending triangle chart pattern.
However, the RSI still hovering above level-25 after the first hike above level-75 suggests a breakout to the upside.
Pancake Swap (CAKE) Daily Chart Analysis
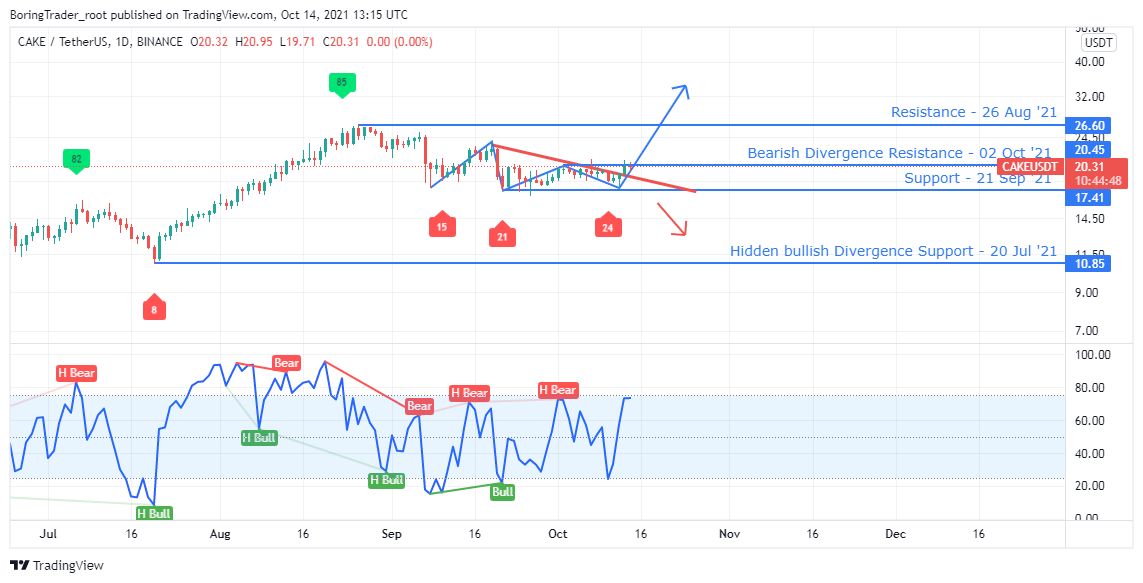
The price action on the daily time frame confirms our upside hypothesis with the RSI dropping below level-25 on the 10 & 22 September and 10 October ’21.
A descending triangle, that’s similar to that of the weekly time frame hints at an incoming hike in demand for the CAKE token. The bulls will have to find their way above the 02 October resistance [20.45] as confirmation of the upside breakout.
Pancake Swap (CAKE) 4HR Chart Analysis
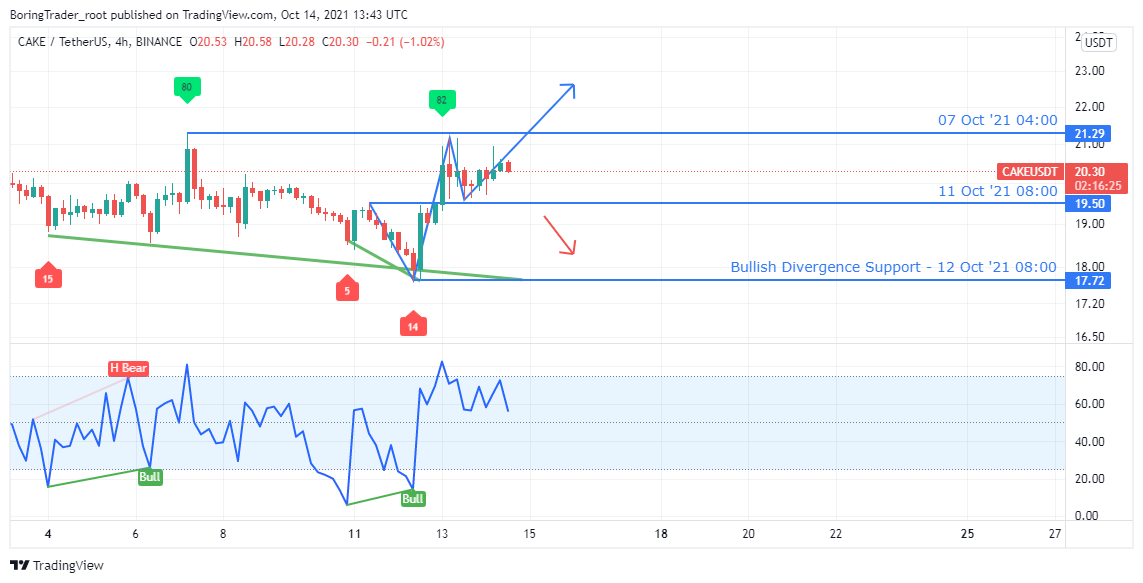
A final view into the intraday 4HR time frame shows a surge in demand for the Binance Smart Chain DEX [CAKE] following a regular bullish divergence on 12 October ’21 08:00.
Buying pressure has flipped the 11 October 08:00 resistance [19.50] into a new support line, forcing the CAKEUSDT to trade between the 07 and 11 October resistance and support range.
A bullish scenario for the upside would be an entry and exit of the RSI oversold area [level-25]. Conversely, a breakdown of the 19.50 support would send the price racing toward the 17.72 support.
We favor a breakout to the upside as the RSI already trades below level-25 at press time.
Pancake Swap (CAKE) Intraday Levels
- Spot rate: 19.87
- Mid–Term Trend [H4]: Strong Bullish
- Volatility: High
- Support: $17.72 and $19.50
- Resistance: $21.29 and $26.60
Play 10,000+ Casino Games at BC Game with Ease
- Instant Deposits And Withdrawals
- Crypto Casino And Sports Betting
- Exclusive Bonuses And Rewards


Why Trust CoinGape
CoinGape has covered the cryptocurrency industry since 2017, aiming to provide informative insights Read more… to our readers. Our journal analysts bring years of experience in market analysis and blockchain technology to ensure factual accuracy and balanced reporting. By following our Editorial Policy, our writers verify every source, fact-check each story, rely on reputable sources, and attribute quotes and media correctly. We also follow a rigorous Review Methodology when evaluating exchanges and tools. From emerging blockchain projects and coin launches to industry events and technical developments, we cover all facets of the digital asset space with unwavering commitment to timely, relevant information.

Delivered every day.
- Insights that move markets
- 100,000 active subscribers


- FUNToken Launches First Mobile Game “Bounce Helix” on Android
- Breaking: Citigroup Cuts Bitcoin and Ethereum Price Targets amid CLARITY Act Delays
- Breaking: Bitcoin Treasury Metaplanet Moves 4986 BTC, Stock Price Tanks 12%
- Ripple News: XRPL Breaks Records with 7.7M Users Amid XRP Price Rally
- Argentina Bans Crypto Prediction Platform Polymarket for Illegal Gambling, Follows Colombia
- Bitcoin Price Forecast: Will BTC Break $80k Ahead of Fed Decision Today?
- MSTR Stock Prediction as Strategy Makes Largest Bitcoin Purchase in 2026 and Analyst Targets BTC Price $100K
- Pi Network Price Prediction After Smart Contract and Second Migration Launch
- Pepe Coin Price Surges 20%- How High Can it Go in March?
- Is XRP Price Gearing Up For $2 Level As BTC Rebounds Above $74k?
- Cardano’s $0.50 Resistance- Can “Midnight” Alpha Defy the Fog of War?


