
Chainlink Technical Analysis: LINK On The Cusp Of A Breakdown But Can $10 Support Hold?


- Chainlink breaks down below an ascending triangle pattern.
- LINK/USD could end up in dire losses, likely to refresh support at $8.85 if support at $10 is broken.
Chainlink has continued to lose dominance in market capitalization and comparison to digital assets like Polkadot, Bitcoin Cash, and Binance Coin. The race for the fifth spot in the market is in full swing, but Chainlink appears to have given up already. At the time of writing, LINK is trading at $10.84 after a 0.81% loss on the day. It is currently the eighth-largest cryptocurrency with a market cap of $3.7 billion.
Ascending Triangle Breakdown
Following the declines September’s first week, Chainlink embraced support at $8.85. A reversal came into play almost immediately, with the price spiking above $10, $12, and $13 resistance levels. Unfortunately, the bullish momentum started to lose strength as bears fought to take back control at $13.30. LINK/USD began to pivoting around $12, although the formation of an ascending triangle recently dealt the bulls a blow.
LINK/USD 4-hour chart
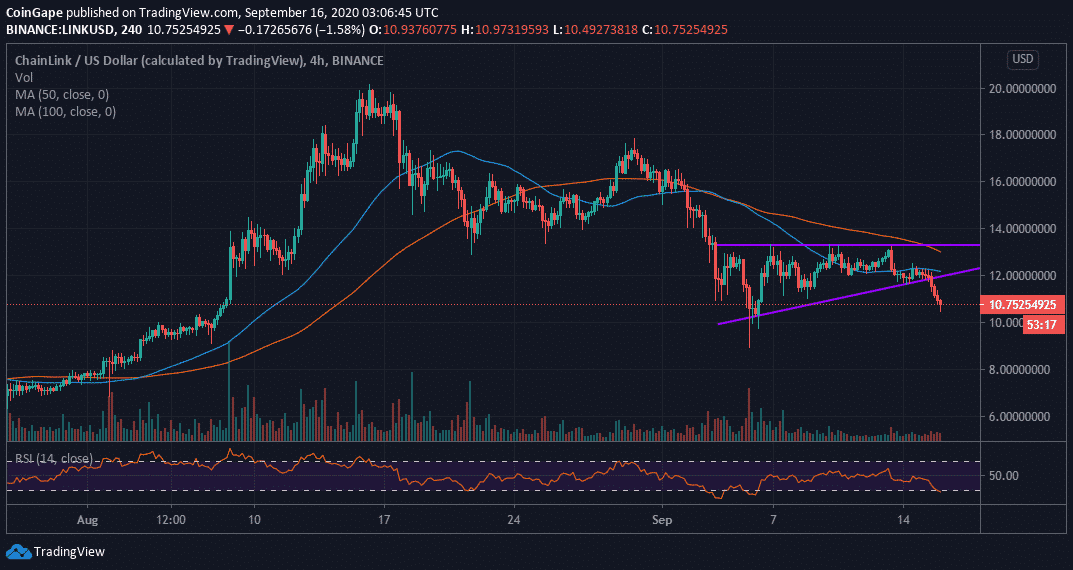
An ascending triangle pattern mainly signals the return of the previous trend. In this case, the breakdown at the beginning of September. However, it is essential to note that a breakout can occur either up or down from the triangle. Meanwhile, the 4-hour chart shows the continuing breakdown below the pattern.
The downtrend is emphasized by the Relative Strength Index (RSI) as dips back into the oversold area. Support at $10 is expected to hold; nevertheless, if it gives in, sellers could increase their activities, in turn, forcing LINK back to support at $8.85.
Chainlink Intraday Levels
Spot rate: $10.84
Relative change: -0.0764
Percentage change: -0.84%
Trend: Bearish
Volatility: Expanding
Play 10,000+ Casino Games at BC Game with Ease
- Instant Deposits And Withdrawals
- Crypto Casino And Sports Betting
- Exclusive Bonuses And Rewards


Why Trust CoinGape
CoinGape has covered the cryptocurrency industry since 2017, aiming to provide informative insights Read more… to our readers. Our journal analysts bring years of experience in market analysis and blockchain technology to ensure factual accuracy and balanced reporting. By following our Editorial Policy, our writers verify every source, fact-check each story, rely on reputable sources, and attribute quotes and media correctly. We also follow a rigorous Review Methodology when evaluating exchanges and tools. From emerging blockchain projects and coin launches to industry events and technical developments, we cover all facets of the digital asset space with unwavering commitment to timely, relevant information.

Delivered every day.
- Insights that move markets
- 100,000 active subscribers


- Breaking: U.S. Prepares for Potential Peace Talks in Iran War as Trump Mulls ‘Winding Down’ Military Efforts
- Crypto Market Recovers as Expert Warns U.S. Easing of Iran Sanctions Won’t Stabilize Oil Prices
- CLARITY Act May Still Delay Despite Stablecoin Yield Deal, Galaxy’s Alex Thorn Warns
- MSTR, COIN, HOOD Stock Prices Crash As FED Rate Hike Odds Climb to 50% in 2026
- US Congress Schedules Tokenization Hearing Next Week as CLARITY Act Advances
- Ethereum, XRP, and Solana Price Prediction As CLARITY Act Advances After Senate–White House Deal
- Why is Pi Network Price Up Today (March 21) Despite Market Wide Correction?
- Bittensor (TAO) Price Surges 20% After Nvidia CEO Comments
- Dogecoin, Shiba Inu, and Pepe Coin Price Prediction If BTC Holds $70k Level
- Cardano (ADA) Price Prediction Amid SEC/CFTC Policy Shift and ETF Update
- Crypto Stock to Watch As Bitcoin Price Crashed Below $70k; CRCL, COIN, MSTR, HOOD


