 Buy $GGs
Dogecoin, COMPOUND and Mina Protocol Price Analysis: 10 December


Dogecoin’s bearish price action has strengthened as the coin has been on a multi-week low. At the time of writing, the altcoin was priced at $0.172 with an immediate support level of $0.161. The price action remained sandwiched between $0.188 and $0.161 over the past week. Technicals for the coin also pointed towards bearishness.
DOGE/USD Chart In The 4-hour Time Frame
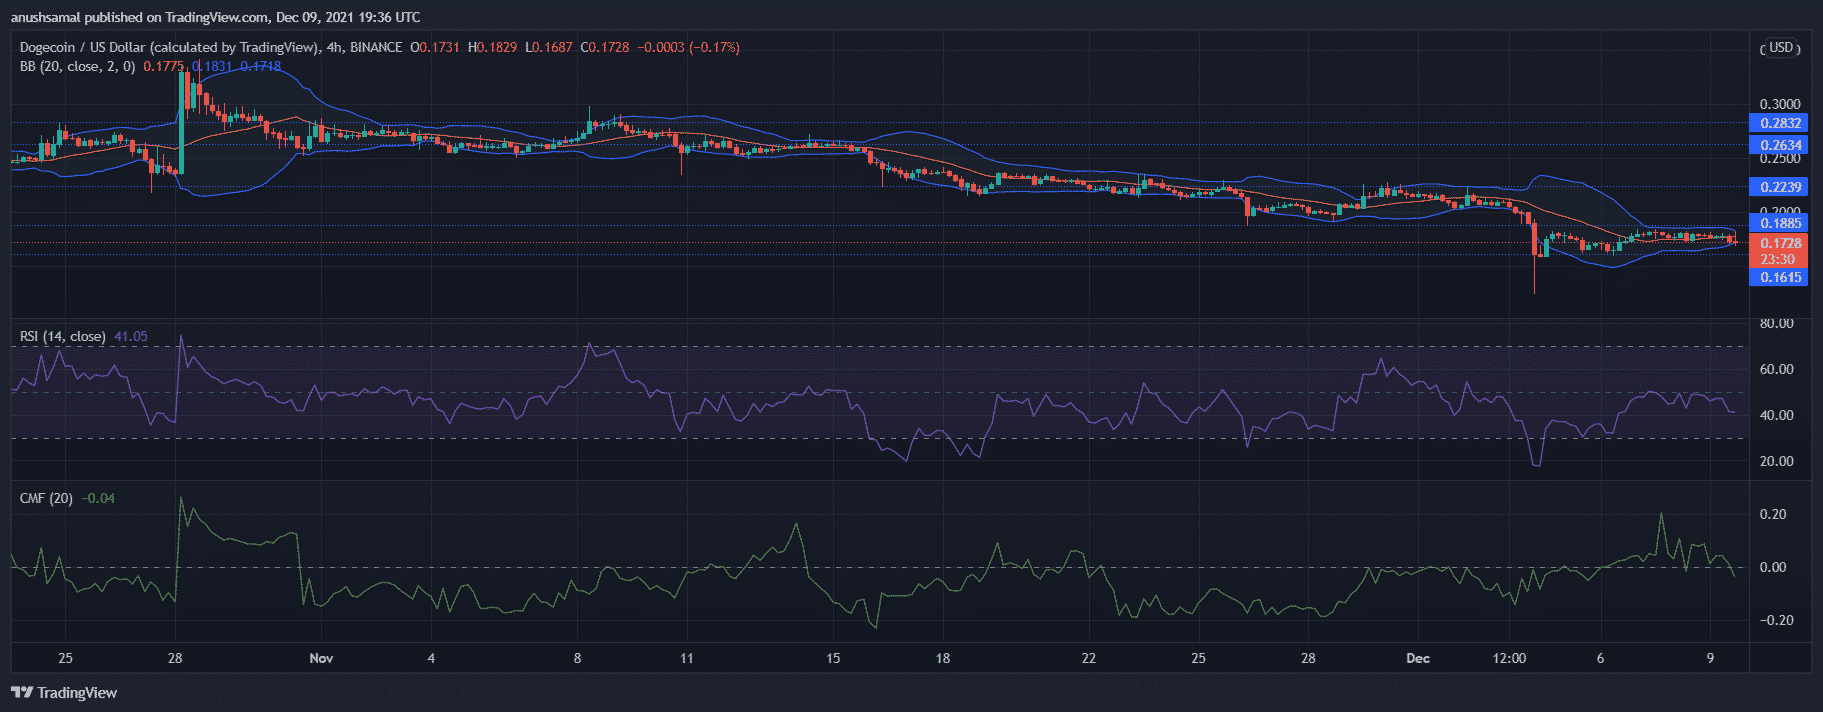
The Relative Strength Index was seen below the half-line, which meant that the sellers exceeded buyers in the market. With continued fall in buying pressure, capital inflows have also reduced as seen on the Chaikin Money Flow indicator.
The Bollinger Bands were constricted, which indicated that DOGE’S price volatility would remain low over the upcoming trading sessions.
Additional resistance levels stood at $0.223 and at $0.263.
COMP/USD Chart In The 4-hour Time Frame
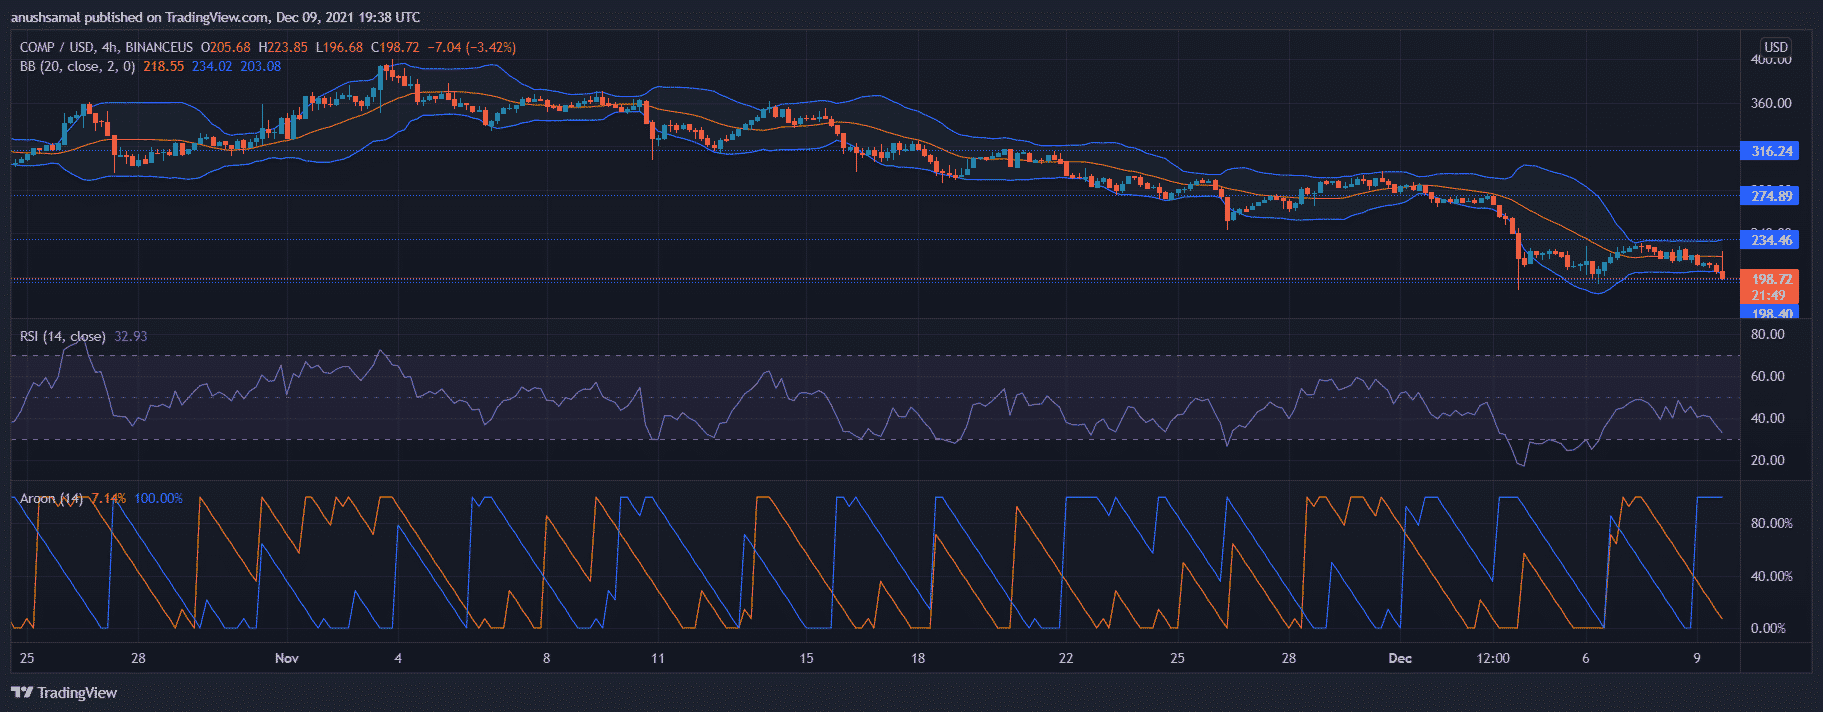
Compound was trading for $198.72 and it had lost 10% of its valuation over the last 24 hours. The local support for the coin stood at $198.40. After trading sideways for a week, buying pressure was considerably low as seen on the Relative Strength Index. The indicator was parked beneath the zero-line in the bearish territory indicating increased selling pressure.
Aroon-Down crossed over the Aroon-Up which indicated a downtrend that the coin had been witnessing over the past few weeks. Bollinger Bands were narrow, which highlighted low price volatility at the current moment.
In case Compound’s buying strength finds its way back into the market, the immediate resistance for the coin stood at $234.46 and then at $274.89 which is the one-week high for the coin.
MINA/USD Chart In The 4-hour Time Frame
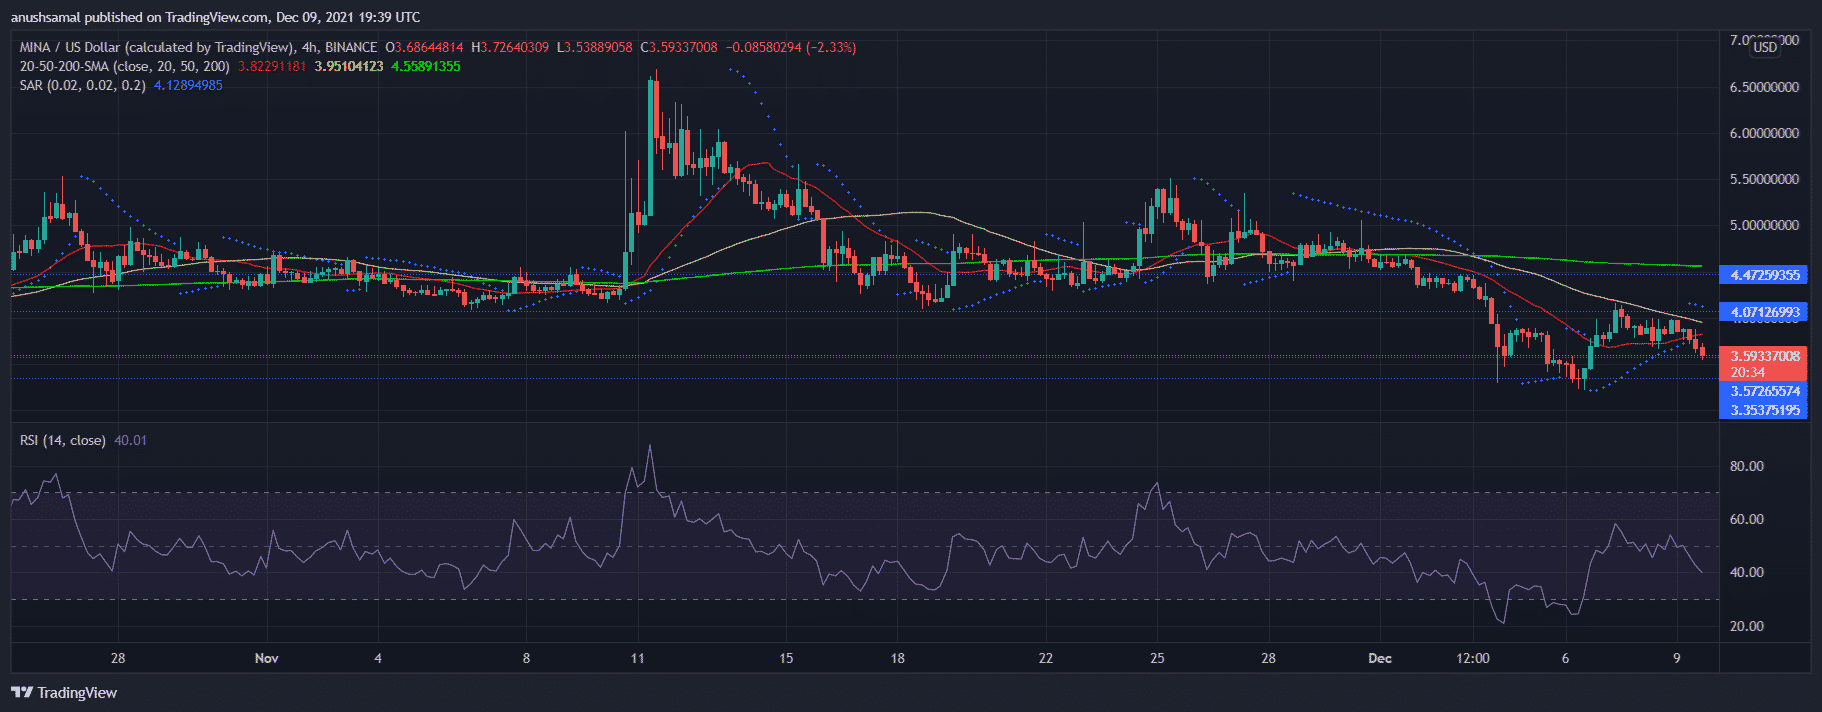
Mina was priced at $3.59 and it had declined on its charts by 8.8% over the last 24 hours. The immediate support region for the coin was at $3.57 and then at $3.35. At the current price, Mina was trading at a multi-month low price level. The outlook for the coin was negative.
On the four-hour chart, the price of the coin was below the 20-SMA indicating that price momentum was in favour of the sellers. Parabolic SAR’s dotted lines were seen above the price candlesticks which indicated a downtrend of prices.
The Relative Strength Index was seen parked underneath the half-line into the bearish zone, after being inside the bullish territory briefly in the past few days. At the time of writing, sellers exceeded buyers in the market.
Play 10,000+ Casino Games at BC Game with Ease
- Instant Deposits And Withdrawals
- Crypto Casino And Sports Betting
- Exclusive Bonuses And Rewards


Why Trust CoinGape
CoinGape has covered the cryptocurrency industry since 2017, aiming to provide informative insights Read more… to our readers. Our journal analysts bring years of experience in market analysis and blockchain technology to ensure factual accuracy and balanced reporting. By following our Editorial Policy, our writers verify every source, fact-check each story, rely on reputable sources, and attribute quotes and media correctly. We also follow a rigorous Review Methodology when evaluating exchanges and tools. From emerging blockchain projects and coin launches to industry events and technical developments, we cover all facets of the digital asset space with unwavering commitment to timely, relevant information.

Delivered every day.
- Insights that move markets
- 100,000 active subscribers
Related Articles


- Crypto Market Update: Top 3 Reasons Why BTC, ETH, XRP and ADA is Up
- Crypto News: Bitcoin Sell-Off Fears Rise as War Threatens Iran’s BTC Mining Operations
- U.S.–Iran War: Monday Crypto Crash Odds Rise As Pundits Predict Oil Price Spike
- US-Iran War: Reports Confirm Bombings In UAE, Bahrain and Kuwait As Crypto Market Makes Recovery
- XRP Price Dips on US-Iran Conflict, But Capitulation Signals March Rebound
- Bitcoin And XRP Price As US Kills Iran Supreme Leader- Is A Crypto Crash Ahead?
- Gold Price Prediction 2026: Analysts Expect Gold to Reach $6,300 This Year
- Circle (CRCL) Stock Price Prediction as Today is the CLARITY Act Deadline
- Analysts Predict Where XRP Price Could Close This Week – March 2026
- Top Analyst Predicts Pi Network Price Bottom, Flags Key Catalysts
- Will Ethereum Price Hold $1,900 Level After Five Weeks of $563M ETF Selling?


