 Buy $GGs
Dogecoin, Polkadot Price Analysis: June 19, 2021


- Dogecoin plunges toward $0.24 amid another crypto selloff.
- Polkadot slides under $20 as declines to $14.5 loom.
The cryptocurrency market is like a sea of bloody waters after losses ensued during the weekend session. Stability has been ousted from the market, hinting at continued widespread retracements. Bitcoin is heading back to the support at $33,000 while Dogecoin (DOGE) and Polkadot (DOT) are the worst hit in the top ten.
Dogecoin:-
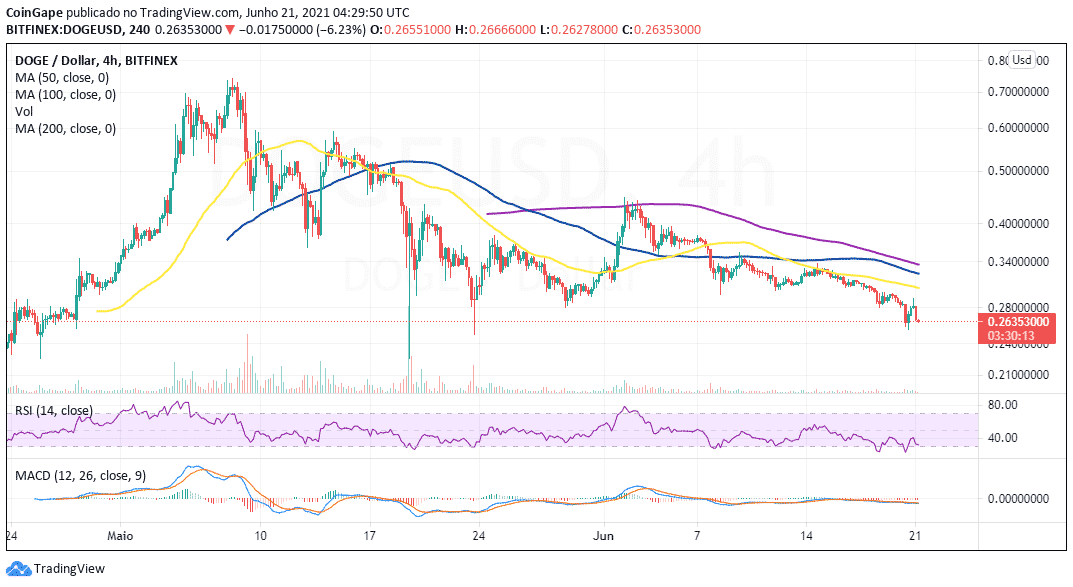
Dogecoin lost the support at $0.3 last week, allowing bears to swing into action powerfully. The following tentative support at $0.28 failed to hold the price as Dogecoin explored the rabbit hole to $0.25.
A reflex recovery stalled at $0.28 while losses gained momentum. At the time of writing, Dogecoin trades at $0.26 and may retest the support at $0.25 or $0.24 before a formidable recovery comes into the picture.
The downtrend is supported by most of the short-term technical indicators, such as the Relative Strength Index (RSI). This technical tool follows the trend of an asset and calculates the strength of the bulls or bears. As the RSI dips under the midline, the bearish outlook is validated.
DOGE/USD four-hour chart
Polkadot:-
Polkadot is back to trading under the crucial support at $20. Last week the token hit highs of $26.5, but bulls couldn’t sustain the uptrend. The reversal that followed was accentuated by widespread losses across the crypto market in the weekend session.
Meanwhile, the least resistance path is downward based on the Moving Average Convergence Divergence (MACD) indicator. Realize that crossing into the negative region was a bearish signal. Moreover, bears grew stronger as the MACD line moved beneath the signal line.
At the time of writing, Polkadot has revisited the levels under $20 and trades at $19.20. If the technical outlook remains unchanged, investors can expect another dip toward the support in May at $14.5.
DOT/USD four-hour chart
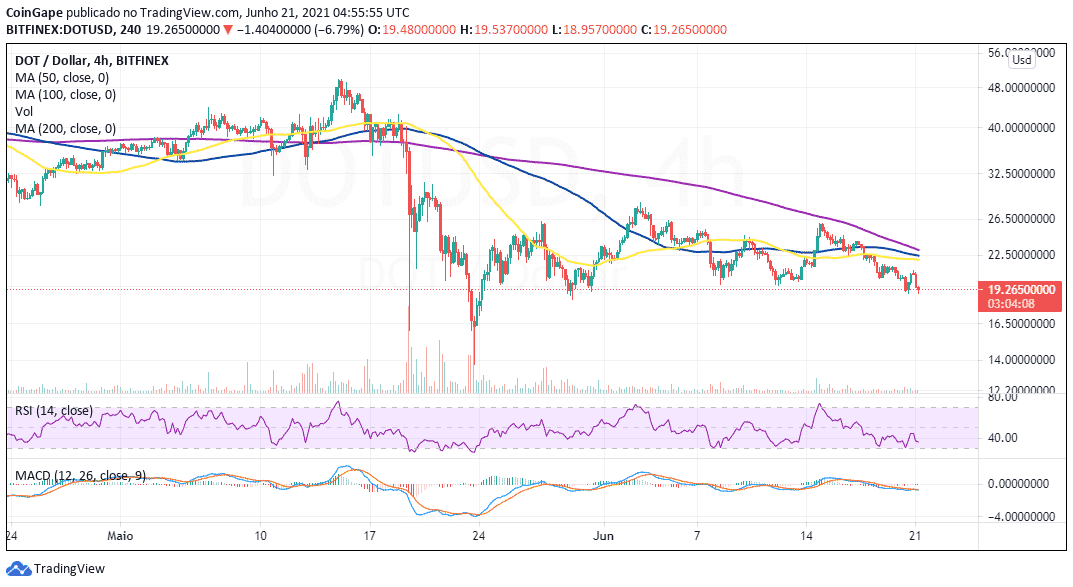
Despite the path with minor hurdles being on the downside, reclaiming the ground above $20 would call more bulls into the market. The uptrend will also be emphasized by the MACD line (blue) crossing above the signal line and the entire indicator moving into the positive region.
Play 10,000+ Casino Games at BC Game with Ease
- Instant Deposits And Withdrawals
- Crypto Casino And Sports Betting
- Exclusive Bonuses And Rewards


Why Trust CoinGape
CoinGape has covered the cryptocurrency industry since 2017, aiming to provide informative insights Read more… to our readers. Our journal analysts bring years of experience in market analysis and blockchain technology to ensure factual accuracy and balanced reporting. By following our Editorial Policy, our writers verify every source, fact-check each story, rely on reputable sources, and attribute quotes and media correctly. We also follow a rigorous Review Methodology when evaluating exchanges and tools. From emerging blockchain projects and coin launches to industry events and technical developments, we cover all facets of the digital asset space with unwavering commitment to timely, relevant information.

Delivered every day.
- Insights that move markets
- 100,000 active subscribers
Related Articles


- US-Iran War: Reports Confirm Bombings In UAE, Bahrain and Kuwait As Crypto Market Makes Recovery
- XRP Price Dips on US-Iran Conflict, But Capitulation Signals March Rebound
- Crypto Market at Risk as U.S.–Iran War Threatens Inflation With Oil Price Surge
- Polymarket U.S.–Iran Strike Bets Fuel Insider Trading Speculation as Crypto Traders Net $1.2M
- Cardano’s DeFi TVL Climbs as USDCx Stablecoin Launches on Network
- Top Analyst Predicts Pi Network Price Bottom, Flags Key Catalysts
- Will Ethereum Price Hold $1,900 Level After Five Weeks of $563M ETF Selling?
- Top 2 Price Predictions Ethereum and Solana Ahead of March 1 Clarity Act Stablecoin Deadline
- Pi Network Price Prediction Ahead of Protocol Upgrades Deadline on March 1
- XRP Price Outlook As Jane Street Lawsuit Sparks Shift in Morning Sell-Off Trend
- Dogecoin, Cardano, and Chainlink Price Prediction As Crypto Market Rebounds


