
DOT Price Prediction: Polkadot(DOT) Price Eyes $100, Here Are Next Levels to Look Out on Daily, Weekly and 4 Hr Charts


Will Polkadot (DOT) price breach $100? Polkadot announced that DOT token holders had passed Referendum 41 and a successful Parachain launch sets Polkadot up for the next step in its journey towards being a multi-chain network.
Major Market Updates for Polkadot (DOT)
- Polkadot’s Parachain auctions will make it possible for developers to register, build, and source funding for their projects on the Polkadot ecosystem.
- Joe Petrowski a member of Web3 Foundation believes that the success of Kusama and assessment by Parity shows that the code for Parachains, auctions, and crowd loans are all ready for an initial production release.
Going forward, let’s analyze the price charts of the DOT vs. BTC and DOT vs. USDT, identifying the significant levels and chart patterns and seeing how the recent fundamental events and announcements show the trend direction.
DOT Price Prediction: DOTBTC Weekly Chart

DOT the native cryptocurrency of the Polkadot ecosystem breaks above the bearish trend line and 13 September resistance against the BTC, followed by a bull-trap candlestick formation after last week’s price close.
Following the recent events on the Polkadot network, the bull-trap candlestick formation may only last for a price correction in the new week, and we can see increased demand for the DOT token over Bitcoin in the coming days.
DOT Price Prediction: DOTUSDT Weekly Chart

Starting the DOTUSDT analysis from a weekly chart overview, we notice a breakout of bearish divergence resistance after the recent weekly closing price.
Although we may see a short-term slowing of the DOTUSDT, the general trend outlook for the crypto-pair remains bullish in the mid-term.
Higher RSI readings above level-75 already hint at a parabolic price surge for the DOTUSDT as we enter the remaining weeks of Q4 ’21.
DOT Price Prediction: DOTUSDT Daily Chart

Last week’s bullish closing price and rejection of the significant bearish resistance shows that the DOTUSDT could surge towards the $100.00 round number resistance in the coming weeks, considering that the DOTUSDT crypto-pair already flags a parabolic trajectory with a higher RSI reading on the daily time frame.
DOT Price Prediction: DOTUSDT 4 Hr Chart
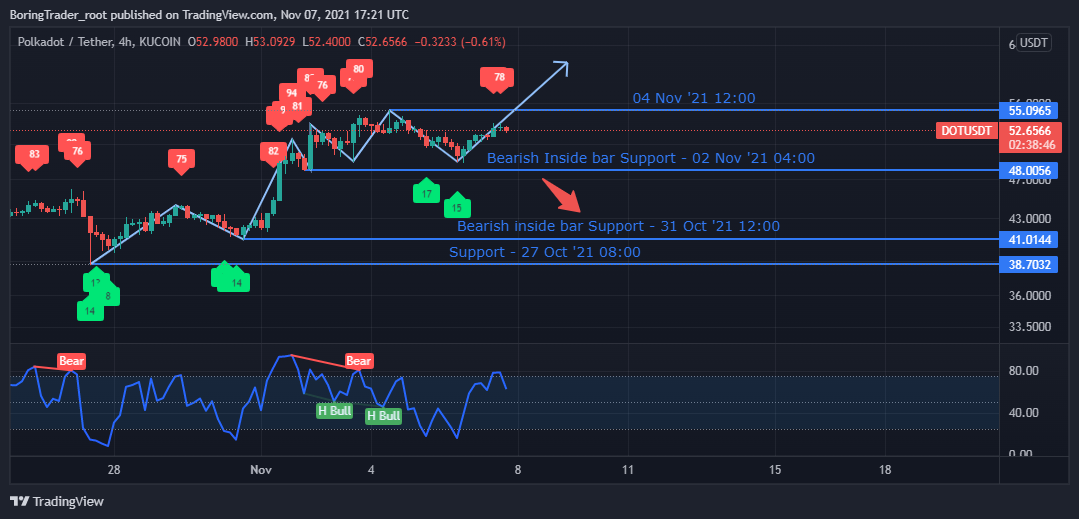
After finding support above the inside-bar support of 02 November 04:00, we start to see a slowing of bullish momentum upon reaching the 04 November 12:00 resistance.
The DOTUSDT could trade within the $55.0965 and 48.0056 price range before bursting into new price highs in the coming days.
However, a breakdown of the $48.0056 support hints at a dipper price correction before the anticipated bullish trajectory. The DOT ecosystem maintains a bullish sentiment as we go into the new week.
Play 10,000+ Casino Games at BC Game with Ease
- Instant Deposits And Withdrawals
- Crypto Casino And Sports Betting
- Exclusive Bonuses And Rewards


Why Trust CoinGape
CoinGape has covered the cryptocurrency industry since 2017, aiming to provide informative insights Read more… to our readers. Our journal analysts bring years of experience in market analysis and blockchain technology to ensure factual accuracy and balanced reporting. By following our Editorial Policy, our writers verify every source, fact-check each story, rely on reputable sources, and attribute quotes and media correctly. We also follow a rigorous Review Methodology when evaluating exchanges and tools. From emerging blockchain projects and coin launches to industry events and technical developments, we cover all facets of the digital asset space with unwavering commitment to timely, relevant information.

Delivered every day.
- Insights that move markets
- 100,000 active subscribers


- Crypto Leaders Call Stablecoin Yield Text Language in CLARITY Act as “Restrictive”
- FUNToken Unveils 2026-2027 Roadmap, Blending Gaming, AI, and Tokenized Asset Innovation
- CLARITY Act: Passage Odds Surge to 68% With Crypto and Bank Reps Set To Review Stablecoin Yield Deal
- Crypto Market Slips as Iran Rejects Claims of U.S. Peace Talks
- Breaking: Tom Lee’s BitMine Acquires 65,341 ETH as BMNR Stock Price Surges
- Top Factors Behind Shiba Inu (SHIB) Price Surging Today
- Gold Vs BTC: Bitcoin Outperforms Gold by 23% – Is $75K Next Amid Trump’s Five Day Pause
- Crypto Stocks to Watch As Trump Issues 48-Hour Iran Ultimatum- CRCL, COIN, and MSTR Price Analysis
- XRP Price Prediction Ahead of March 27 SEC Spot ETF Decision
- Will Solana Price Recover This Week Amid New SEC/CFTC Crypto Rules?
- Ethereum, XRP, and Solana Price Prediction As CLARITY Act Advances After Senate–White House Deal


