DOT Price Analysis: DOT Breaks All-Time High, Wait for Dip Or Buy Now?


Historical data reveals a consecutive slump of Polkadot’s DOT price upon reaching 1billion USD open interest. Increasing open interest shows a growth in the number of derivatives contracts that’s currently at play, which also implies more retail trading involved with the crypto-asset.
- Polkadot’s founder Dr. Gavin Wood stated that the 960 million USD grant will be used to develop, improve, and educate the growing ecosystem of the Polkadot network.
- Projects looking to launch on the Polkadot network are currently raising capital to bootstrap their Parachain auctions, while Polkadot investors look out for the best projects to support by locking their DOT tokens while expecting air-dropped tokens in return.
Let’s dive into the price charts of the DOTBTC and DOTUSDT and get an idea of how the upcoming Parachain auction, among other fundamental events, could affect the DOT price.
Polkadot Price Analysis: DOTBTC Weekly Chart
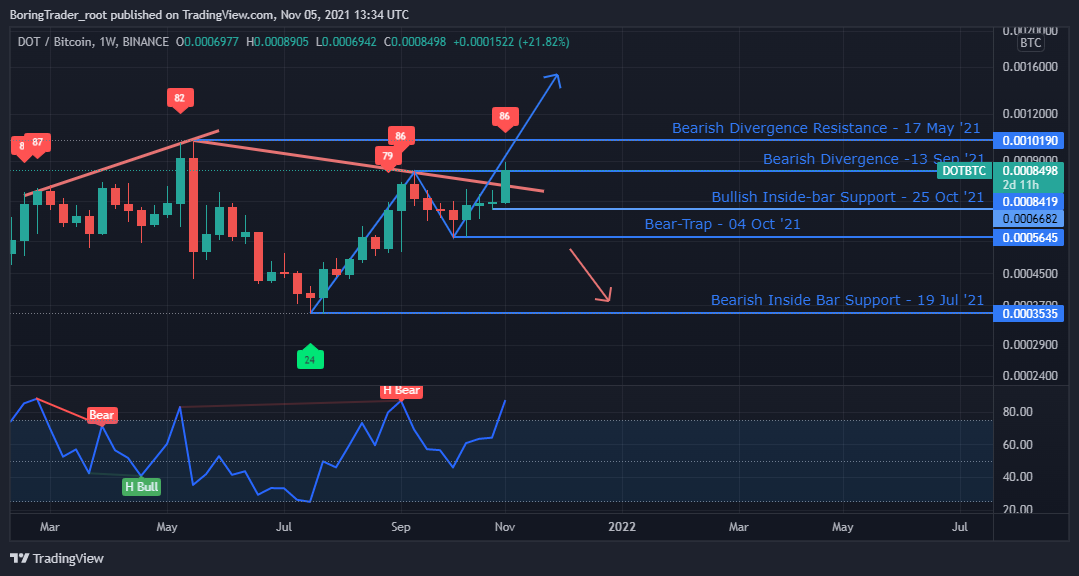
A series of bearish divergence setups on the DOTBTC chart suggested an increase in demand for the BTC over the DOT crypto-asset.
However, recent higher RSI readings hint at a bullish sentiment towards the DOTBTC pair, which suggests growing demand for the DOT altcoin.
The bullish inside bar support that followed the bear-trap candlestick pattern confirmed a decision for the DOTBTC to breakout above the bearish trend line from the bearish divergence on 13 September ’21.
Polkadot Price Analysis: DOTUSDT Weekly Chart
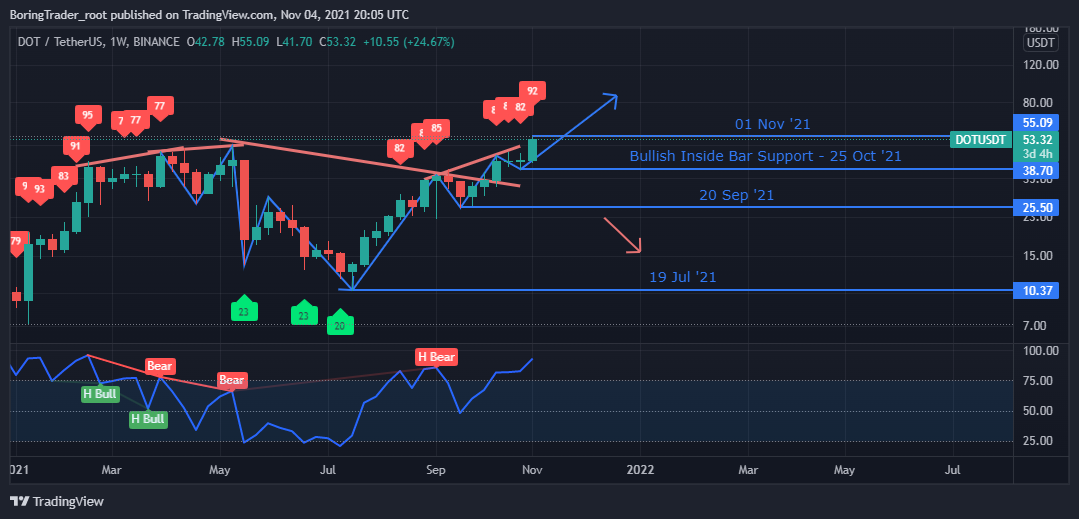
Following a similar path as the DOTBTC, the DOTUSDT price from the weekly chart above sky-rocket after a bullish inside-bar candlestick pattern on 25 Oct ’21.
The resistance level established by the bearish divergence [13 September ‘21] gave in to growing buying power on 11 October ’21 and sends the DOTUSDT into new price discovery zones.
Polkadot Price Analysis: DOTUSDT Daily Chart
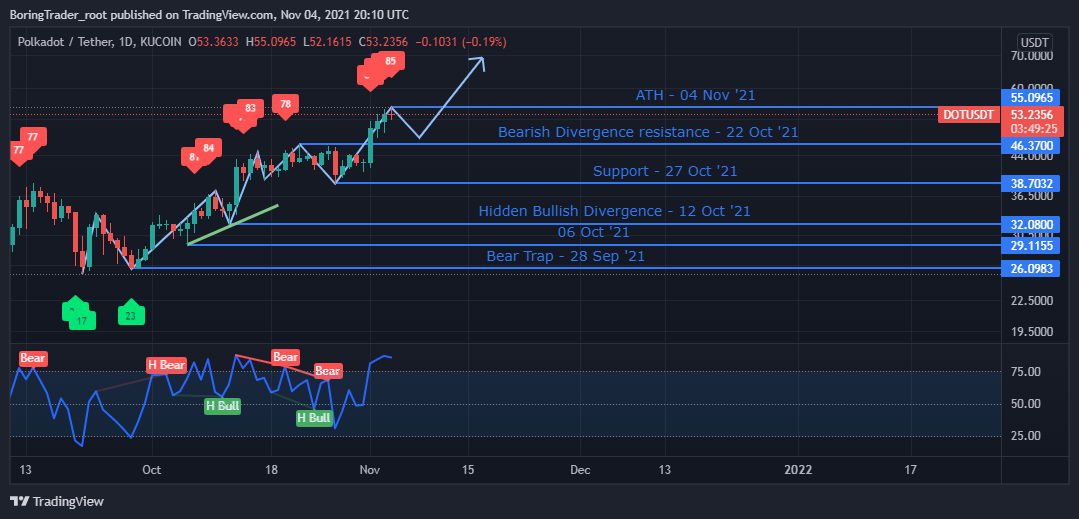
A daily chart overview shows the DOTUSDT in an established uptrend with higher RSI values above level-25 and level-75 [red colored labels] after exiting a consolidation phase that was set up by alternating bearish and bullish divergence signals.
We expect a price pull-back towards the 22 October support for a chance to scale back into the growing trend.
Polkadot Price Analysis: DOTUSDT 4 Hr Chart
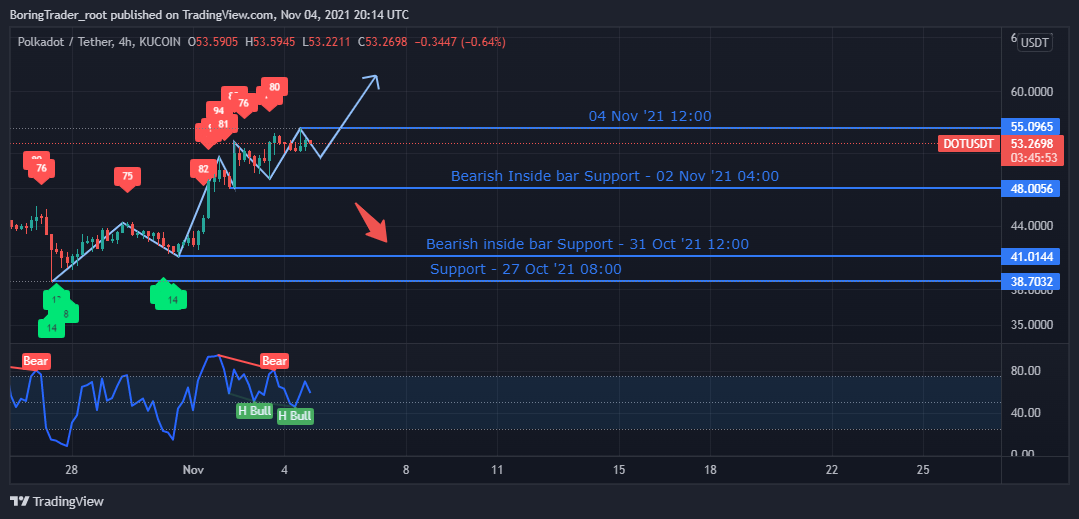
The rising trend continues on the intraday 4HR time frame as the DOTUSDT sets higher peaks and higher troughs.
Opposing bearish and bullish divergence setups at press time signal a slowing of the rising trend where RSI values below level-25 should signal the continuation of the uptrend.
A breakdown of the $48.0056 support could imply a steep price pull-back before resuming the bullish campaign.

Why Trust CoinGape
CoinGape has covered the cryptocurrency industry since 2017, aiming to provide informative insights Read more… to our readers. Our journal analysts bring years of experience in market analysis and blockchain technology to ensure factual accuracy and balanced reporting. By following our Editorial Policy, our writers verify every source, fact-check each story, rely on reputable sources, and attribute quotes and media correctly. We also follow a rigorous Review Methodology when evaluating exchanges and tools. From emerging blockchain projects and coin launches to industry events and technical developments, we cover all facets of the digital asset space with unwavering commitment to timely, relevant information.

Delivered every day.
- Insights that move markets
- 100,000 active subscribers
Related Articles


- XRP Realized Losses Spike to Highest Level Since 2022, Will Price Rally Again?
- Crypto Market Rises as U.S. and Iran Reach Key Agreement On Nuclear Talks
- Trump Tariffs: U.S. Raises Global Tariff Rate To 15% Following Supreme Court Ruling
- Bitwise CIO Names BTC, ETH, SOL, and LINK as ‘Mount Rushmore’ of Crypto Amid Market Weakness
- Prediction Market News: Kalshi Faces New Lawsuit Amid State Regulatory Crackdown
- Pi Network Price Prediction: How High Can Pi Coin Go?
- Dogecoin Price Prediction Feb 2026: Will DOGE Break $0.20 This month?
- XRP Price Prediction As SBI Introduces Tokenized Bonds With Crypto Rewards
- Ethereum Price Rises After SCOTUS Ruling: Here’s Why a Drop to $1,500 is Possible
- Will Pi Network Price See a Surge After the Mainnet Launch Anniversary?
- Bitcoin and XRP Price Prediction As White House Sets March 1st Deadline to Advance Clarity Act


